Chapter 1 Summary and Review
Study Guide
| KEY TERMS AND CONCEPTS | EXAMPLES | ||||||||||||||||||
|---|---|---|---|---|---|---|---|---|---|---|---|---|---|---|---|---|---|---|---|
| SECTION 1.1: INTRODUCTION TO GRAPHING | |||||||||||||||||||
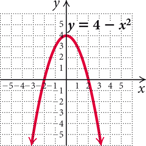
Graphing Equations To graph an equation is to make a drawing that represents the solutions of that equation. We can graph an equation by selecting values for one variable and finding the corresponding values for the other variable. We list the solutions (ordered pairs) in a table, plot the points, and draw the graph. |
Graph: .

|
||||||||||||||||||
Intercepts An x-intercept is a point (a, 0). To find a, let and solve for x. A y-intercept is ... | |||||||||||||||||||
Get Algebra and Trigonometry, 5th Edition now with the O’Reilly learning platform.
O’Reilly members experience books, live events, courses curated by job role, and more from O’Reilly and nearly 200 top publishers.

