Chapter 9. Understanding Sequence and Time Series Data
Time series are everywhere. You’ve probably seen them in things like weather forecasts, stock prices, and historic trends like Moore’s law (Figure 9-1). If you’re not familiar with Moore’s law, it predicts that the number of transistors on a microchip will roughly double every two years. For almost 50 years it has proven to be an accurate predictor of the future of computing power and cost.
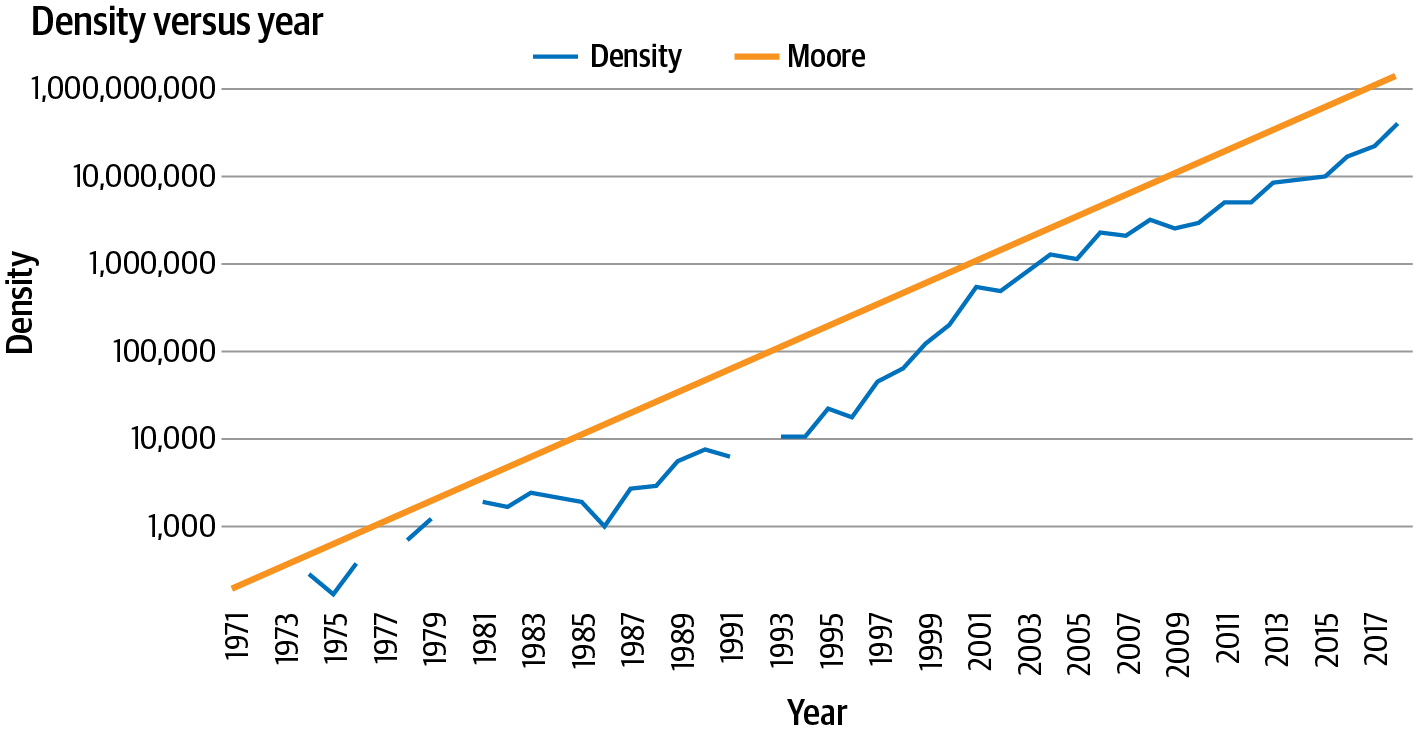
Figure 9-1. Moore’s law
Time series data is a set of values that are spaced over time. When plotted, the x-axis is usually temporal in nature. Often there are a number of values plotted on the time axis, such as in this example where the number of transistors is one plot and the predicted value from Moore’s law is the other. This is called a multivariate time series. If there’s just a single value—for example, volume of rainfall over time—it’s called a univariate time series.
With Moore’s law, predictions are simple because there’s a fixed and simple rule that allows us to roughly predict the future—a rule that has held for about 50 years.
But what about a time series like that in Figure 9-2?
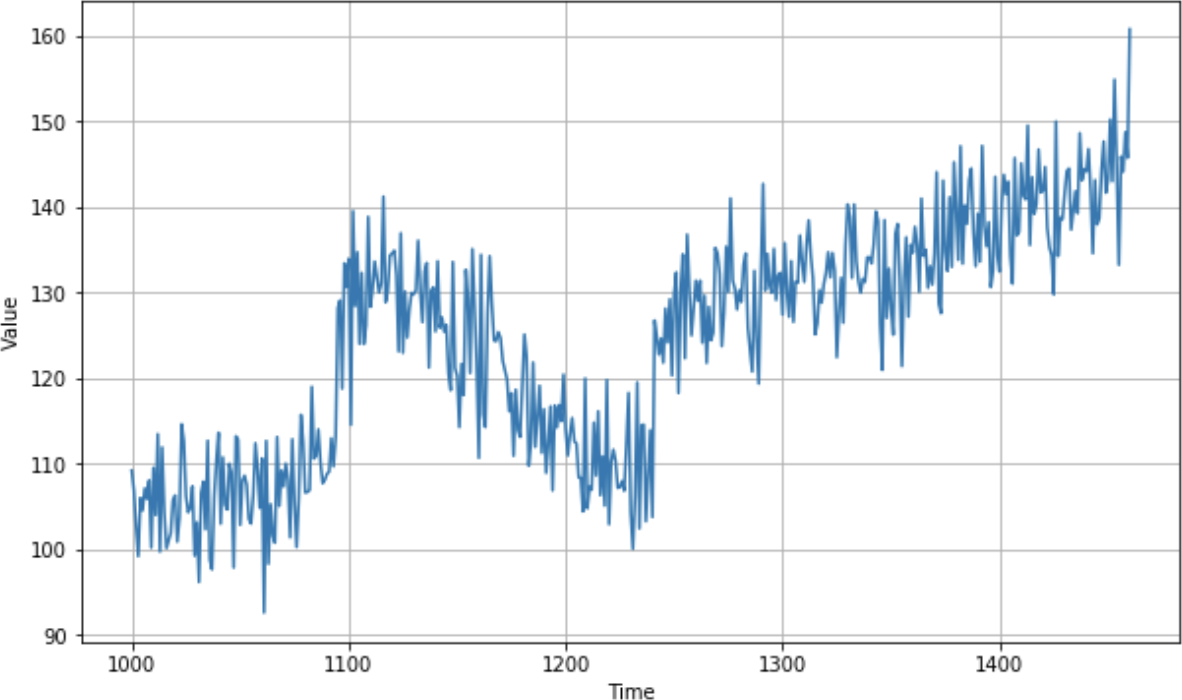
Figure 9-2. A real-world time series
While this time series was artificially created (you’ll see how to do that later in this chapter), it has all ...
Get AI and Machine Learning for Coders now with the O’Reilly learning platform.
O’Reilly members experience books, live events, courses curated by job role, and more from O’Reilly and nearly 200 top publishers.

