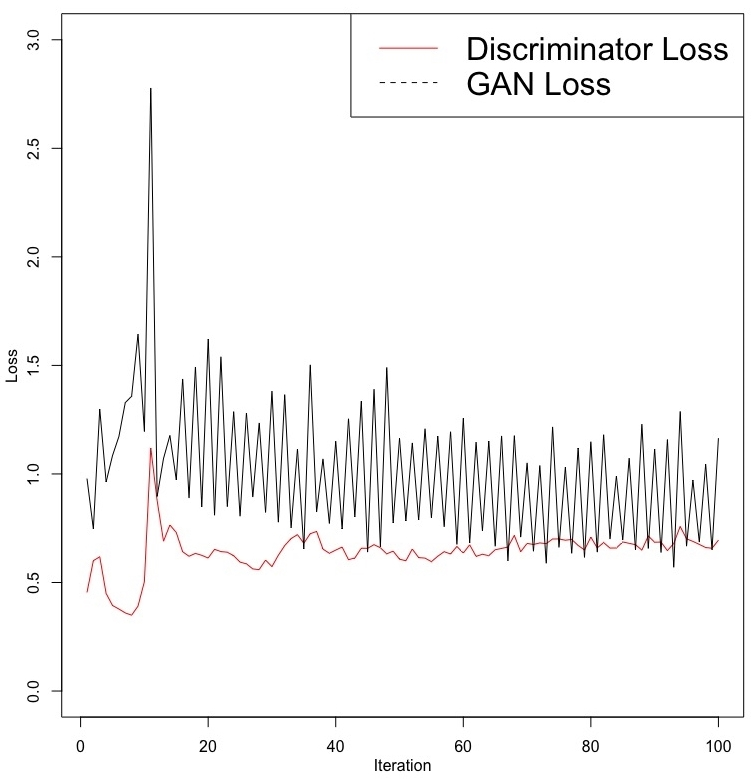
The discriminator and GAN loss values that were obtained from our 100 iterations can be plotted as follows. The discriminator loss is based on the loss values for the fake and real images:

From the preceding plot, we can make the following observations:
- The loss values for the discriminator network and the GAN show high variability during the first 20 iterations. This variability is an outcome of the learning process.
- The discriminator and generator networks are competing against each other and trying to do better than one another. When one network performs better, it is at the cost of the other network. This ...

