In this first experiment, we will use the adam optimizer when compiling the model. At the time of training the model, we will also increase the number of epochs to 20.
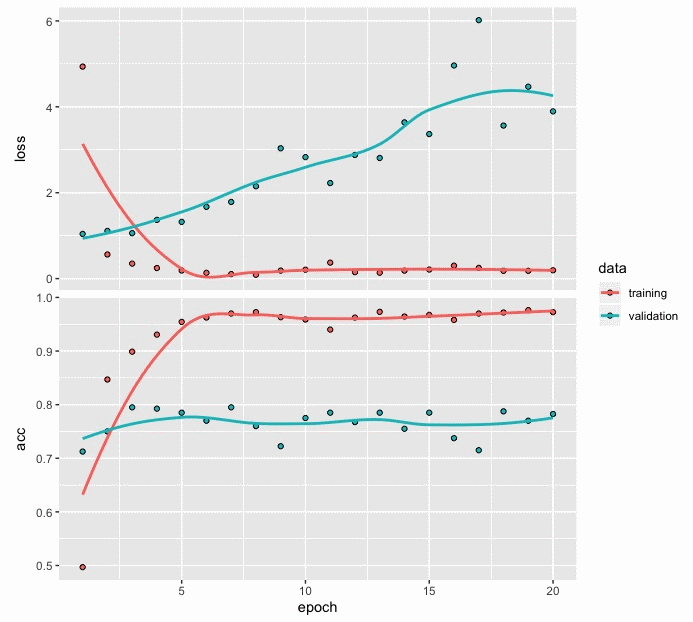
The plot of the accuracy and loss values after training the model is as follows:

The preceding loss and accuracy plot for this model shows that the values related to the training data are flat after about six epochs. For the validation data, the loss values show a gradual increase, whereas the accuracy values are flat after the third epoch.
The code for obtaining the loss, accuracy, and confusion matrix for the test data is as follows:

