CHAPTER 4
Types of Charts
You don’t need a weatherman to know which way the wind blows.
—Bob Dylan
■ Bar Charts
Bar charts are by far the most common type of price chart. In a daily bar chart, each day is represented by a vertical line that ranges from the daily low to the daily high. The day’s closing value is indicated by a horizontal protrusion to the right of the bar, while the opening price is represented by a protrusion to the left of the bar. Figure 4.1 is a daily bar chart of the July 2015 soybean contract.
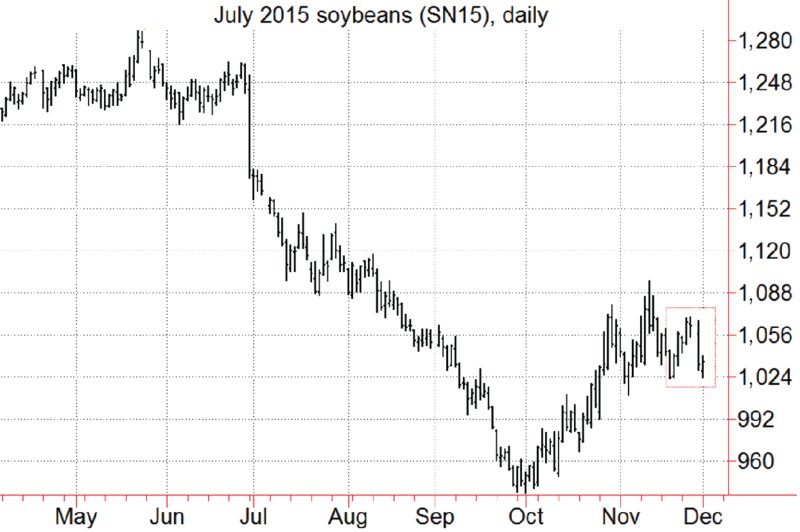
Figure 4.1 Daily Bar Chart: July 2015 Soybeans
The daily (or intraday for short-term traders) bar chart is most useful for trading purposes, but bar charts for longer data periods provide extremely important perspective. These longer-period bar charts (e.g., weekly, monthly) are entirely analogous to the daily bar chart, with each vertical line representing the price range and final price level for the period. Figure 4.2 is a weekly bar chart for soybean futures. The segment within the rectangle corresponds to the period depicted in Figure 4.1. Figure 4.3 is a monthly bar chart for soybean futures, and the two rectangles enclose the periods depicted in Figures 4.2 and 4.1.
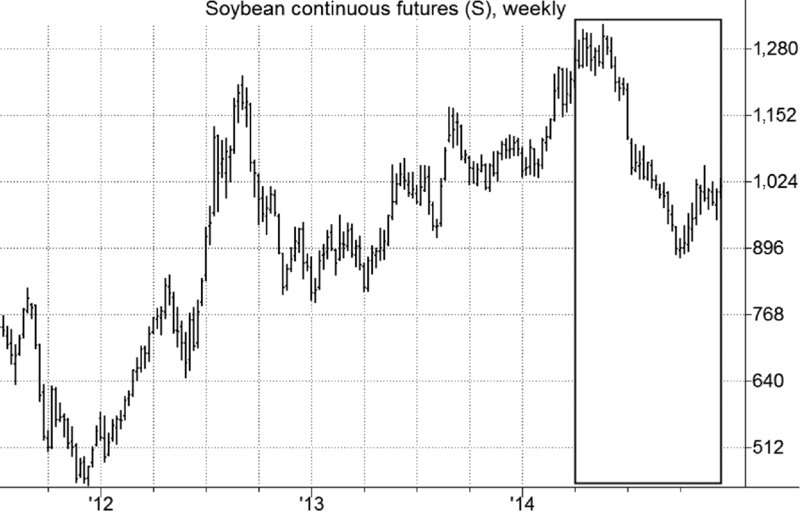
Figure 4.2 Weekly Bar Chart: Soybeans (Continuous Futures)
Note: Continuous futures ...
Get A Complete Guide to the Futures Market, 2nd Edition now with the O’Reilly learning platform.
O’Reilly members experience books, live events, courses curated by job role, and more from O’Reilly and nearly 200 top publishers.

