Using computer vision to understand big visual data
Alyosha Efros discusses using computer vision to understand big visual data.
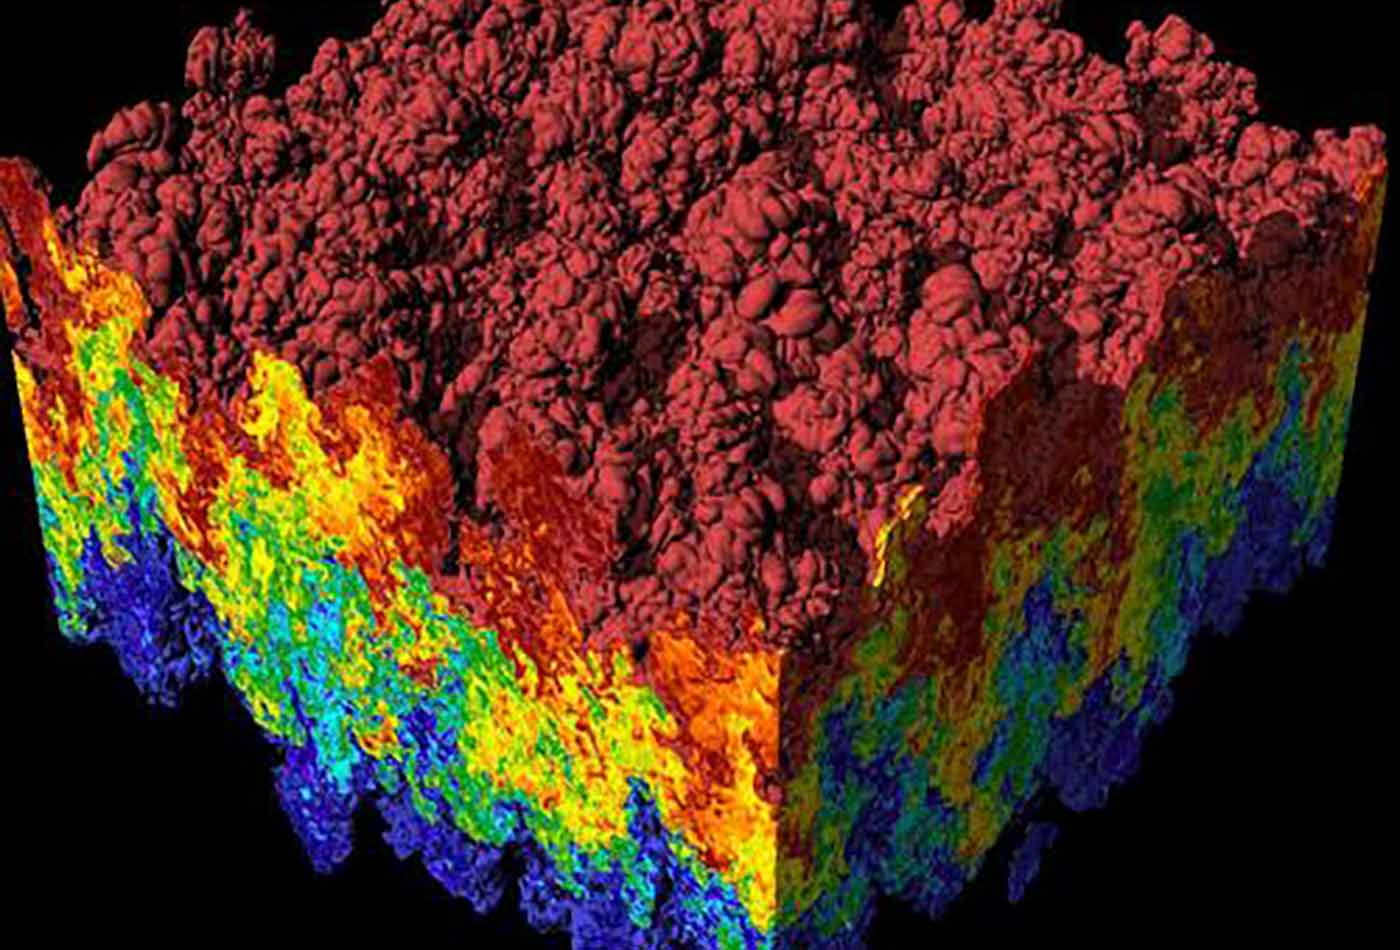
 Scientific visualization of an extremely large simulation of a Rayleigh–Taylor instability problem. (source: Lawrence Livermore National Laboratory on Wikimedia Commons)
This is a keynote presentation from Strata + Hadoop World in San Jose 2016. Watch more full keynotes from the event.
You can also get notified when the Strata + Hadoop World in San Jose 2016 full video compilation becomes available for purchase.
