Top Node.js metrics to watch
Track key metrics to keep your Node.js apps running smoothly.
 Meters (source: Pixabay)
Monitoring Node.js Applications presents special challenges. The dynamic nature of the language provides many “opportunities” for developers to produce memory leaks, and a single function blocking the event queue can have a huge impact on the overall application performance. Parallel execution of jobs is done using multiple worker processes using the “cluster” functionality to take full advantage of multi-core CPUs — but the master and worker processes belong to a single application, which means that they should be monitored together. Let’s have a deep look at the top metrics in Node.js applications to get a better understanding of why they are so important to monitor.
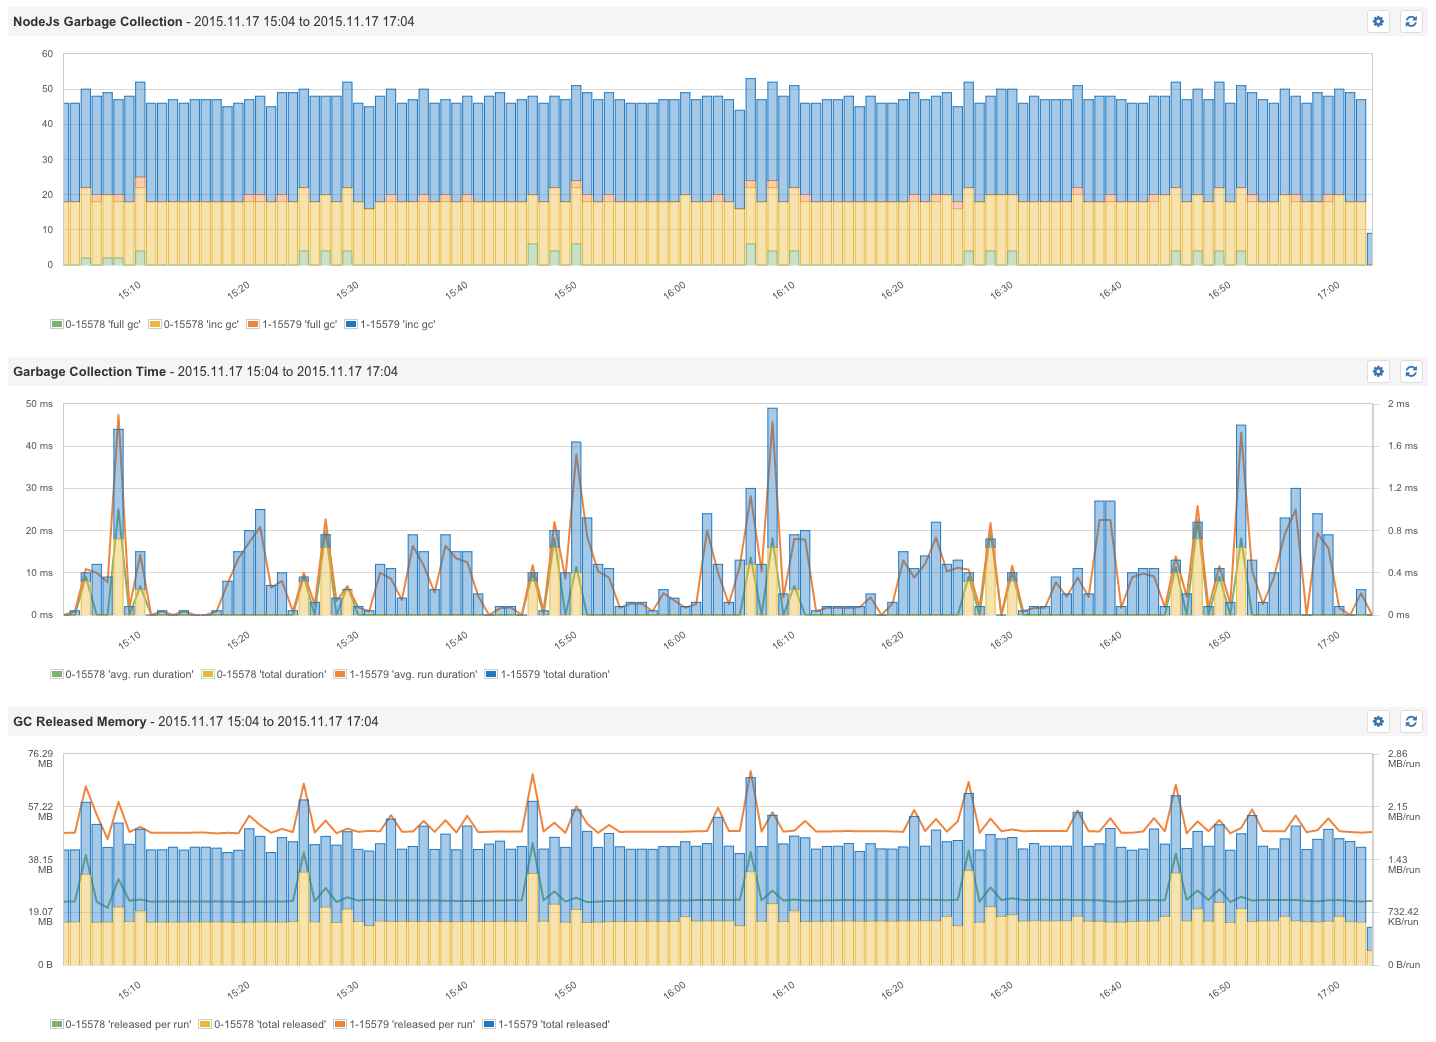
Garbage Collection & Process Memory – Node.js is based on Google’s Chrome V8 Javascript engine. Garbage Collection reclaims memory used by objects that are no longer required. The V8 garbage collection stops the program execution. Incremental GC cycles (scavenging) process only a part of the Heap and are very fast. Full GC cycles deal with objects that survived multiple incremental GC runs. Full GC runs are executed less frequently to minimize pauses in the program execution.
With regard to garbage collection metrics, we should first measure all the time spent for garbage collection. In addition, it is useful to see how often a full GC cycle — or incremental GC cycle — is executed. The size of heap memory can be compared with the size of the last GC run to see if there is a growing trend. That’s why the following metrics should be monitored:
- Time consumed for garbage collection
- Counters for full GC cycles
- Counters for incremental GC cycles
Note: All images in this post are from Sematext’s SPM Performance Monitoring tool and its Node.js integration.

Aside from how often GC happens and how long it takes, we can measure the effect on memory by providing the following metrics:
- Released memory between GC cycles (see above)
- Process Heap Size and Heap Usage

Event Loop – The secret of Node.js’s performance is its ability to be CPU bound and use async operations; in that way CPU can be highly utilized and doesn’t waste cycles waiting for I/O operations. This means a server can take many connections and will not be blocked for async operations. As soon as the operation is finished callback functions are used to continue processing. The implementation is based on a single event loop, which processes the async function calls in a separate thread. Using synchronous operations drags down performance because other operations need to wait to be executed. That’s why the golden rule for Node.js performance is “don’t block the event loop”.
The metric to watch is the Latency to process the next event:
– Slowest Event Handling (Max Latency)
– Average Event Loop Latency
– Fastest Event Handling (Min Latency)

A high latency in the event loop might indicate the use of blocking (sync) or time consuming functions in event handlers, which could impact the performance of the whole Node.js application.
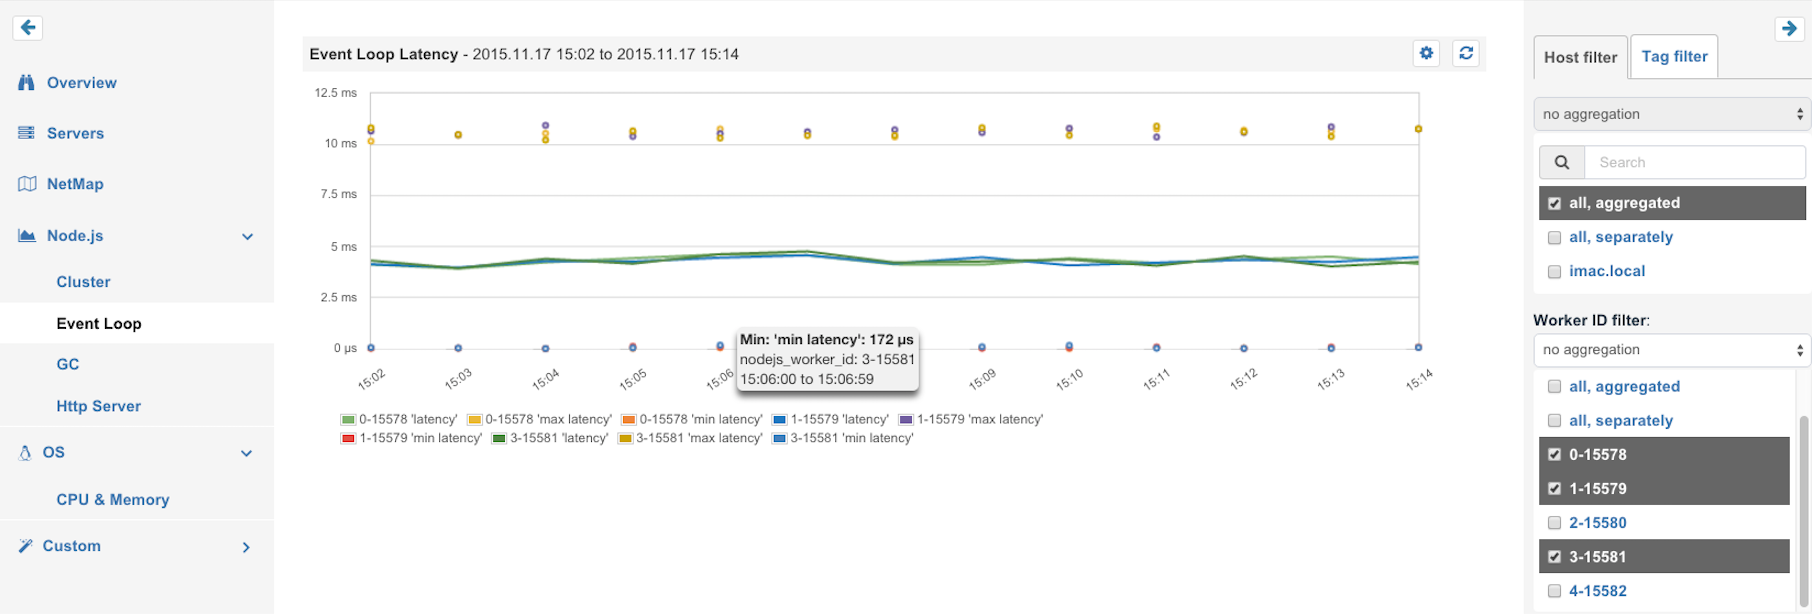
Cluster Mode and number of processes – To scale Node.js beyond the capacity of a single process the use of master and worker processes is required — the so called “cluster” mode. Master processes share sockets with the forked worker process and can exchange messages with it. A typical use case for web servers is forking N worker processes, which operate on the shared server socket and handle the requests in round robin (since Node v0.12). In many cases programs choose N with the number of CPUs the server provides — that’s why a constant number of worker processes should be the regular case. If this number changes it means worker processes have been terminated for some reason. In the case of processing queues, workers might be started on demand. In this scenario it would be normal that the number of workers changes all the time, but it might be interesting to see how long a higher number of workers was active. Using a tool like SPM for Node.js lets one track the number of workers. When picking a monitoring solution or developing your own monitoring for Node.js, make sure it is capable of filtering by hostname and worker ID. Keep in mind Node.js workers can have a very short lifetime that traditional monitoring tools may not be able to handle well.

For example, to compare event loop latency in different Node.js sub-processes, we need to be able to select workers we want to compare:

Web Frameworks – There is a steadily growing number of frameworks to build web services using Node.js. The most popular are: Express, Hapi.js, Restify, Mean.io, Meteor, and many more. When doing HTTP monitoring, here are some of the key metrics to pay attention to:
- Response time (http/https)
- Request rate
- Error rates (total, error categories)
- Request/Response content size

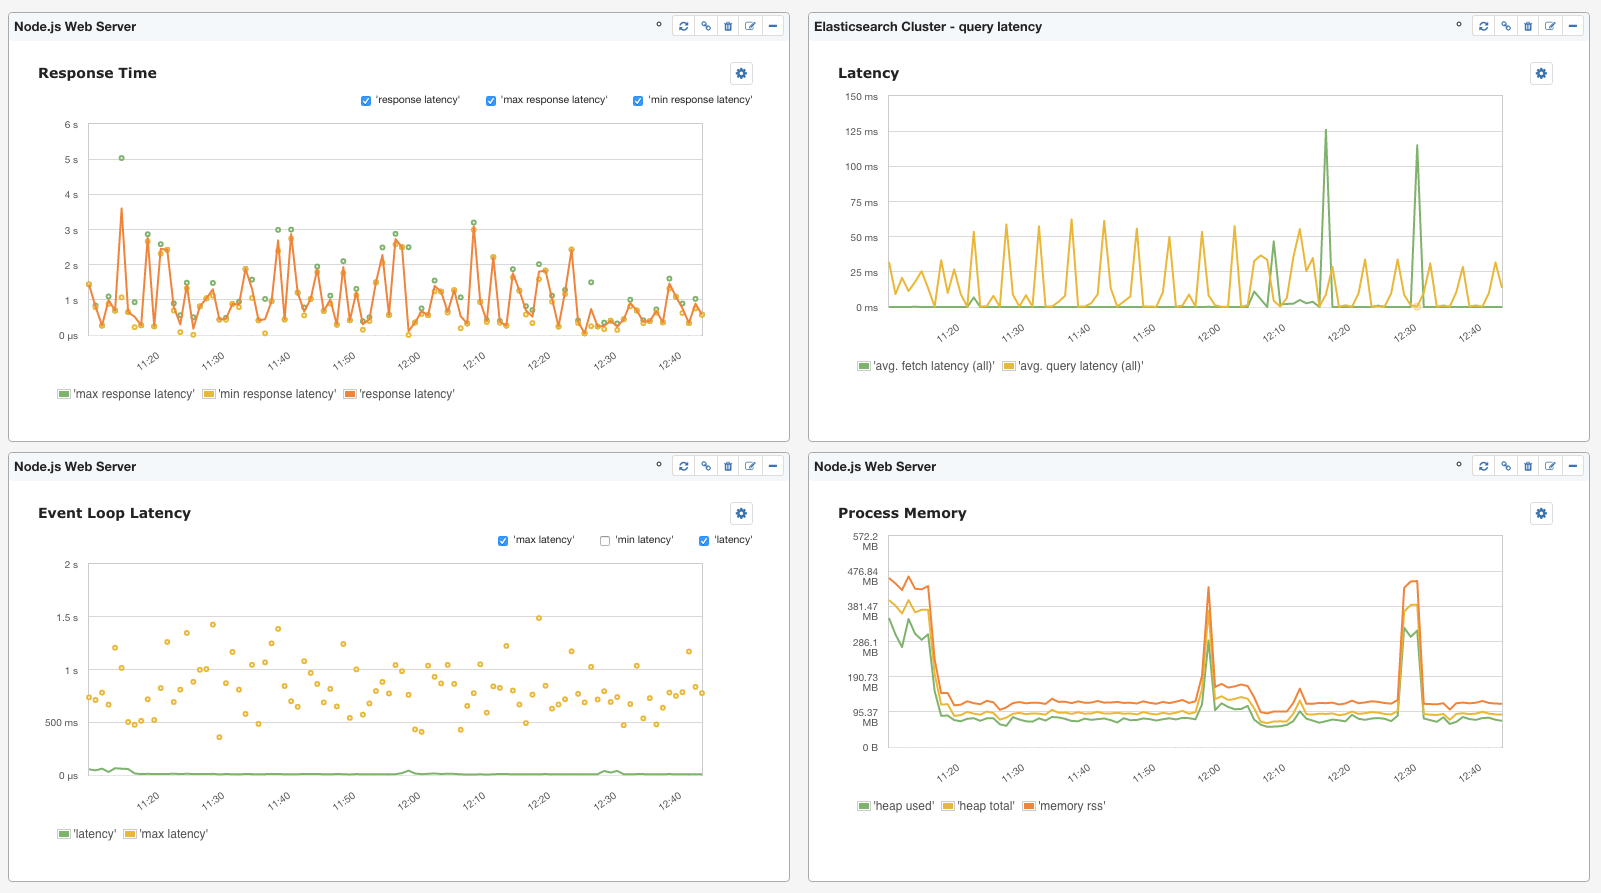
Of course, Node.js apps don’t run in a vacuum. They connect to other services, other types of applications, caches, data stores, etc. As such, while knowing what key Node.js metrics are, monitoring Node.js alone or monitoring it separately from other parts of the infrastructure is not the best practice. If there is one piece of advice I can give to anyone looking into (Node.js) monitoring it is this: when you buy a monitoring solution or if you are building it for your own use, make sure you end up with a solution that is capable of showing you the big picture. For example, Node.js is often used with Elasticsearch (see 10 Elasticsearch Metrics to Watch), Redis, etc. Seeing metrics for all the systems that surround Node.js apps is precious. Here is just a small example of a dashboard showing a few Node.js and Elasticsearch metrics together.

There you have it — the Top Node.js metrics to watch.
This post is part of a collaboration between O’Reilly and Sematext. See our statement of editorial independence.
