A primer on performance of web applications
Learn the basics of measuring performance from chapter 2 of High Performance Responsive Design.
 Yayoi Kusama, Walking in My Mind, Hayward Gallery (source: Flickr)
Primer on Performance of Web Applications
The Basics of Measuring Performance
If you are reading this book, the chances are good that you have an idea of what performance is, or at the very least, you have had some discussion around the performance of your web applications. But before we go any further, let’s make sure we are on the same page with respect to terminology.
If this is your first time hearing the term web performance optimization, quickly go pick up a copy of Steve Souders’s books High Performance Web Sites and Even Faster Web Sites (both from O’Reilly). These are the standards in web performance, and they represent the base level of knowledge that all web developers should have.
The goal of this chapter is not to cover every nuance of performance. There is an enormous corpus of work that already achieves that goal, starting with the aforementioned publications of Steve Souders. Rather, the goal of this chapter is to give an overview of performance, both web performance and web runtime performance, including some of the tools used to measure performance. This way, when we reference these concepts in later chapters, there should be no confusion or ambiguity.
When talking about the performance of websites and web applications, we are speaking either of web performance or runtime performance. We define web performance as a measurement of the time from when an end user requests a piece of content to when that content is available on the user’s device. We define runtime performance as an indication of how responsive your application is to user input at runtime.1
Being aware of, quantifying, and crafting standards around the performance of your web applications is a critical aspect of application ownership. Both web performance and runtime performance have indicators that you can empirically measure and quantify. In this chapter, we will be looking at these indicators and the tools that you can use to quantify them.
Note
Performance indicators are measurable objectives that organizations use to define success or failure of an endeavor. They are sometimes called key performance indicators, or KPIs for short.
The types of performance indicators that we will be talking about in this chapter are as follows:
- Quantitative indicator
-
An objective that can be measured empirically (think quantity of something)
- Qualitative indicator
-
An objective that cannot be measured empirically (think quality of something)
- Leading indicator
-
Used to predict outcomes
- Input indicator
-
Used to measure resources consumed during a process
What is Web Performance?
Think about each time you’ve surfed the Web. You open a browser, type in a URL and wait for the page to load. The time it takes from when you press Enter after typing the URL (or clicking a bookmark from your bookmark list, or clicking a link on a page) until the page renders is the web performance of the page you are visiting. If a site is performing properly, this time should not even be noticeable.
The quantitative indicators of web performance are numerous enough to list:
The qualitative indicator of web performance can be summed up much more succinctly: perception of speed.
Before we look at these indicators, let’s first discuss how pages make it to the browser and are presented to our users. When you request a web page by using a browser, the browser creates a thread to handle the request and initiates a Domain Name System (DNS) lookup at a remote DNS server, which provides the browser with the IP address for the URL you entered.
Next, the browser negotiates a Transmission Control Protocol (TCP) three-way handshake with the remote web server to establish a Transmission Control Protocol/Internet Protocol (TCP/IP) connection. This handshake consists of synchronize (SYN), synchronize-acknowledge (SYN-ACK), and acknowledge (ACK) messages that are passed between the browser and the remote server.
After the TCP connection has been established, the browser sends an HTTP GET request over the connection to the web server. The web server finds the resource and returns it in an HTTP response, the status of which is 200 to indicate a good response. If the server cannot find the resource or generates an error when trying to interpret it, or if it is redirected, the status of the HTTP response will reflect these as well. You can find the full list of status codes at http://bit.ly/stat-codes. Following are the most common of them:
-
200 indicates a successful response from the server
-
301 signifies a permanent redirection
-
302 indicates a temporary redirection
-
403 is a forbidden request
-
404 means that the server could not find the resource requested
-
500 denotes an error when trying to fulfill the request
-
503 specifies the service is unavailable
-
504 designates a gateway timeout
Figure 1-1 presents a sequence diagram of this transaction.

Keep in mind that not only is one of these transactions necessary to serve up a single HTML page, but your browser needs to make an HTTP request for each asset to which the page links—all of the images, linked CSS and JavaScript files, and any other type of external asset. (Note, however, that the browser can reuse the TCP connection for each subsequent HTTP request as long as it is connecting to the same origin.)
When the browser has the HTML for the page, it begins to parse and render the content.
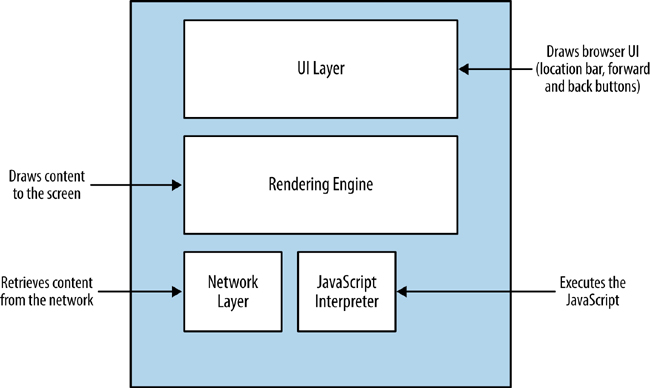
The browser uses its rendering engine to parse and render the content. Modern browser architecture consists of several interacting modules:
- The UI layer
-
This draws the interface or GUI for the browser. These are items such as the location bar, the refresh button, and other elements of the user interface (UI) that is native to the browser.
- The network layer
-
This layer handles network connections, which entails tasks such as establishing TCP connections and handling the HTTP round trips. The network layer handles downloading the content and passing it to the rendering engine.
- The rendering engine
-
Rendering engines are responsible for painting the content to the screen. Browser makers brand and license out their render and JavaScript engines, so you’ve probably heard the product names for the more popular render engines already. Arguably the most popular render engine is WebKit, which is used in Chrome (as a fork named Blink), Safari, and Opera, among many others. When the Render engine encounters JavaScript, it hands it off to the JavaScript interpreter.
- The JavaScript engine
-
This handles parsing and execution of JavaScript. Just like the render engine, browser makers brand their JavaScript engines for licensing, and you most likely have heard of them. One popular JavaScript engine is Google’s V8, which is used in Chrome, Chromium, and as the engine that powers Node.js.
You can see a representation of this architecture in Figure 1-2.
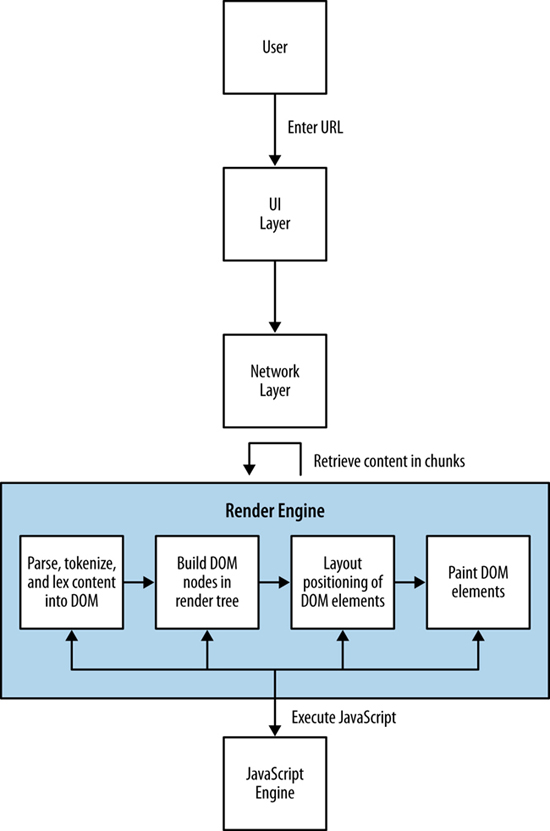
Picture a use case in which a user types a URL into the location bar of the browser. The UI layer passes this request to the network layer, which then establishes the connection and downloads the initial page. As the packets containing chunks of HTML arrive, they are passed to the render engine. The render engine assembles the HTML as raw text and begins to perform lexical analysis—or parsing—of the characters in the text. The characters are compared to a rule set—the document type definition (DTD) that we specify in our HTML document—and converted to tokens based on the rule set. The DTD specifies the tags that make up the version of the language that we will use. The tokens are just the characters broken into meaningful segments.
Here’s an example of how the network layer might return the following string:
<!DOCTYPE html><html><head><meta charset="UTF-8"/>
This string would be tokenized into meaningful chunks:
<!DOCTYPE html>
<html>
<head>
<meta charset="UTF-8"/>
The render engine then takes the tokens and converts them to Document Object Model (DOM) elements (the DOM is the in-memory representation of the page elements, and the API that JavaScript uses to access page elements). The DOM elements are laid out in a render tree over which the render engine then iterates. In the first iteration, the render engine lays out the positioning of the DOM elements; in the next iteration, it paints them to the screen.
If the render layer identifies a script tag during the parsing and tokenization phase, it pauses and evaluates what to do next. If the script tag points to an external JavaScript file, parsing is paused, and the network layer is engaged to download this file prior to initializing the JavaScript engine to interpret and execute the JavaScript. If the script tag contains inline JavaScript, the rendering is paused, the JavaScript engine is initialized, and the JavaScript is interpreted and executed. When execution is complete, parsing resumes.
This is an important nuance that impacts not just when DOM elements are available to JavaScript (our code might be trying to access an element on the page that has not yet been parsed and tokenized, let alone rendered), but also performance. For example, do we want to block the parsing of the page until this code is downloaded and run, or can the page be functional if we show the content first and then load the page?
Figure 1-3 illustrates this workflow for you.
Understanding how content is delivered to the browser is vital to understanding the factors that impact web performance. Also note that as a result of the rapid release schedule of browser updates, this workflow is sometimes tweaked and optimized and even changed by the browser makers.
Now that we understand the architecture of how content is delivered and presented, let’s look at our performance indicators in the context of this delivery workflow.
Number of HTTP requests
Keep in mind that the browser creates an HTTP request when it gets the HTML page, and additional HTTP requests for every asset to which the page links. Depending on network latency, each HTTP request could add 20 to 200 milliseconds to the overall page load time (this number changes when you factor in browsers being able to parallel load assets). This is almost negligible when talking about a handful of assets, but when you’re talking about 100 or more HTTP requests, this can add significant latency to your overall web performance.
It only makes sense to reduce the number of HTTP requests that your page requires. There are a number of ways developers can accomplish this, from concatenating different CSS or JavaScript files into a single file,2 to merging all of their commonly used images into a single graphic file called a sprite.
Page payload
One of the factors impacting web performance is the total file size of the page. The total payload includes the accumulated file sizes of the HTML, CSS, and JavaScript that comprise the page. It also includes all of the images, cookies, and any other media embedded on the page.
Page load time
The number of HTTP requests and the overall page payload by themselves are just input, but the real KPI to focus on for web performance is page load time.
Page load time is the most obvious performance indicator and the easiest to quantify. Simply stated, it is the time it takes a browser to download and render all of the content on the page. Historically, this has been measured as the elapsed time from page request to the page’s window onload event. More recently, as developers are becoming more adept at creating a usable experience before the page has finished loading, that end point has been moving in or even changing completely.
Specifically, there are certain use cases in which you could load content dynamically after the window.onload event has fired—as would be the case if, for instance, content is lazy loaded—and there are use cases in which the page can be usable and appear complete before the window.onload event has fired (such as when you can load content first, and load ads afterward). These cases skew the usefulness of tracking specific page load time against the window.onload event.
There are some options to circumvent this dilemma. Pat Meenan, who created and maintains WebPageTest, has included in WebPageTest a metric called Speed Index that essentially scores how quickly the page content is rendered. Some development teams are creating their own custom events to track when the parts of their page that they determine as core to the user experience are loaded.
However you choose to track it, page load (i.e., when your content is ready for user interaction) is the core performance indicator to monitor.
Tools to Track Web Performance
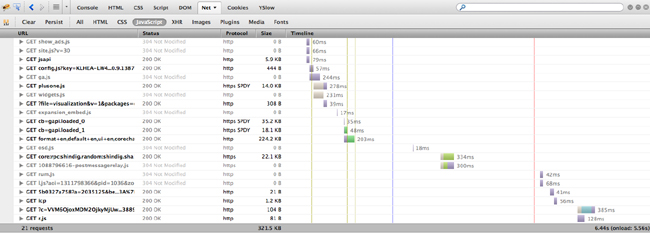
The most common and useful tool to track web performance is the waterfall chart. Waterfall charts are visualizations that you can use to show all of the assets that make up a web page, all of the HTTP transactions needed to load these assets, and the time it takes for each HTTP request. All of these HTTP requests are rendered as bars, with the y-axis being the name or URL of the resource; sometimes the size of the resource and the HTTP status of the response for the resource are also shown in the y-axis. The x-axis, sometimes shown explicitly, sometimes not, portrays elapsed time.
The bars of a waterfall chart are drawn in the order in which the requests happen (see Figure 1-4), and the length of the bars indicates how long the transaction takes to complete. Sometimes, we can also see the total page load time and the total number of HTTP requests at the bottom of the waterfall chart. Part of the beauty of waterfall charts is that from the layout and overlapping of bars we can also ascertain when the loading of some resources blocks the loading of other resources.
These days, there are a number of different tools that can create waterfall charts for us. Some browsers provide built-in tools, such as Firebug in Firefox, or Chrome’s Developer Tools. There are also free, hosted solutions such as webpagetest.com.
Let’s take a look at some of these tools.
The simplest way to generate a waterfall chart is by using an in-browser tool. These come in several flavors, but at this point have more or less homogenized, at least in how they generate waterfall charts (some in-browser tools are far more useful than others, as we will see when we begin discussing web runtime performance).
Firebug was the first widely adopted in-browser developer tool. Available as a Firefox plug-in and first created by Joe Hewitt, Firebug set the standard by not just creating waterfall charts to show the network activity needed to load and render a page, but also to give developers access to a console to run ad hoc JavaScript and show errors, and the ability to debug and step through code in the browser.
If you aren’t familiar with Firebug, you can install it by visiting http://mzl.la/1vDXigg. Click the “Add to Firefox” button and follow the instructions to install the add-on.
Note
Firebug is available for other browsers, but generally in a “lite” version that doesn’t provide the full functionality that’s available for Firefox.

To access a waterfall chart in Firebug, click the Net tab.
The industry has evolved since Firebug first came out, and now most modern web browsers come with built-in tools to measure at least some aspects of performance. Chrome comes with Developer Tools, Internet Explorer has its own developer tools, and Opera has Dragonfly.
In Chrome, to access Developer Tools, click the Chrome menu icon, select Tools, and then, click Developer Tools on the menu that opens, as demonstrated in Figure 1-6.

In Internet Explorer, you click Tools and then select Developer Tools.
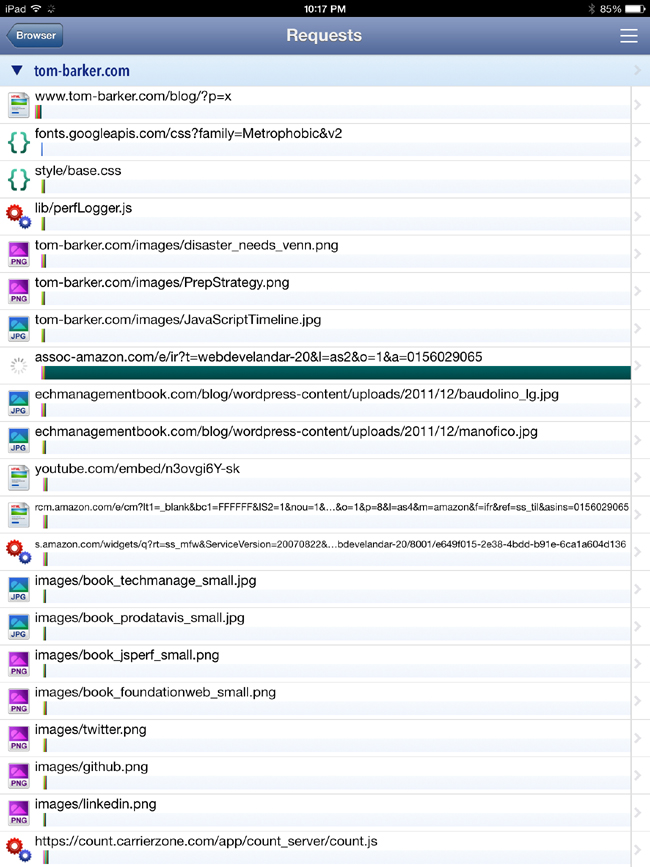
Even mobile devices now have HTTPWatch as a native app that can run a browser within the app and show a waterfall chart for all of the resources that are loaded. HTTPWatch is available at http://bit.ly/1rY322j. Figure 1-7 and Figure 1-8 give you a glimpse of HTTPWatch in action.

In-browser tools are great for debugging, but if you want to start looking at automated solutions that can work in your continuous integration (CI) environment, you need to start expanding your range of options to include platform or headless solutions.
Tip
We talk at great length about headless testing and CI integration in not available.
As mentioned earlier, one of the leading platform solutions is WebPageTest (www.webpagetest.org), which was created and continues to be maintained by Pat Meenan. WebPageTest is available as a hosted solution or open source tool that you can install and run on your network as a local copy to test behind your firewall. The code repository to download and host is available at http://bit.ly/1wu4Zdd.
WebPageTest is a web application that takes a URL (and a set of configuration parameters) as input and runs performance tests on that URL. The amount of parameters that we can configure for WebPageTest is enormous.
You can choose from a set of worldwide locations from which your tests can be run. Each location comes with one or more browsers that you can use for the test at that location. You can also specify the connection speed and the number of tests to run.
WebPageTest provides a wealth of information about the overall performance of a website, including not just waterfall charts but also charts to show the content breakdown of a given page (what percentage of the payload is made up of images, what percentage JavaScript, etc.), screenshots to simulate the experience of how the page loads to the end user, and even CPU usage, which we will discuss in more detail later in this chapter.
Best of all, WebPageTest is fully programmable. It provides an API that you can call to provide all of this information. Figure 1-9 presents a waterfall chart generated in WebPageTest.
But when looking at web performance metrics, the ideal numbers to look at are the results from real user monitoring (sometimes called RUM) harvested from your own users. For a fully programmable solution to achieve this, the World Wide Web Consortium (W3C) has standardized an API that you can use to capture and report in-browser performance data. This is done via the Performance DOM object, an object that is native to the window object in all modern browsers.
In late 2010, the W3C created a new working group called simply the Web Performance Working Group. According to its website, the mission for this working group is to provide methods to measure aspects of application performance of user agent features and APIs. What that means in a very tactical sense is that the working group has developed an API by which browsers can expose to JavaScript key web performance metrics.

Google’s Arvind Jain and Jason Weber from Microsoft chair this working group. You can access the home page at http://bit.ly/1t87dJ0.
The Web Performance Working Group has created a number of new objects and events that we can use to not only quantify performance metrics, but also optimize performance. Here is a high-level overview of these objects and interfaces:
-
The
performanceobject -
This object exposes several objects, such as
PerformanceNavigation,PerformanceTiming,MemoryInfo, as well as the capability to record high resolution time for submillisecond timing - The Page Visibilty API
-
This interface gives developers the capability to check whether a given page is visible or hidden, which makes it possible to optimize memory utilization around animations, or network resources for polling operations.
If you type window.performance in a JavaScript console, you will see that it returns an object of type Performance with several objects and methods that it exposes. As of this writing, the standard set of objects is window.performance.timing for type PerformanceTiming and window.performance.navigation for type PerformanceNavigation. Chrome supports window.performance.memory for type MemoryInfo. We will discuss the MemoryInfo object in the “Web Runtime Performance” section later in this chapter.
It is the PerformanceTiming object that is most useful for monitoring of real user metrics; see Figure 1-10 for a screenshot of the Performance object and the PerformanceTiming object in the console.

Performance object viewed in the console with the Performance.Timing object expandedKeep in mind that the purpose of real user monitoring is to gather actual performance metrics from real users, as opposed to synthetic performance testing, which generates artificial tests in a lab or with an agent following a prescribed script. The benefit of RUM is that you capture and analyze the real performance of your actual user base.
Table 1-1 lists the properties in the PerformanceTiming object.
| Property | Description |
|---|---|
|
|
Captures when navigation begins, either when the browser starts to unload the previous page if there is one, or if not, when it begins to fetch the content. It will either contain the |
|
|
Captures when the browser begins to unload and finishes unloading the previous page (if there is a previous page at the same domain to unload). |
|
|
Captures when the browser begins and completes the DNS lookup for the requested content. |
|
|
Captures when the browser begins and completes any HTTP redirects. |
|
|
Captures when the browser begins and finishes establishing the TCP connection to the remote server for the current page. |
|
|
Captures when the browser first begins to check cache for the requested resource. |
|
|
Captures when the browser sends the HTTP request for the requested resource. |
|
|
Captures when the browser first registers and finishes receiving the server response. |
|
|
Captures when the document begins and finishes loading. |
|
|
Captures when the document’s |
|
|
Captures when the page’s |
|
|
Captures directly before the point at which the load event is fired and right after the load event is fired. |
Figure 1-11 shows the order in which these events occur.
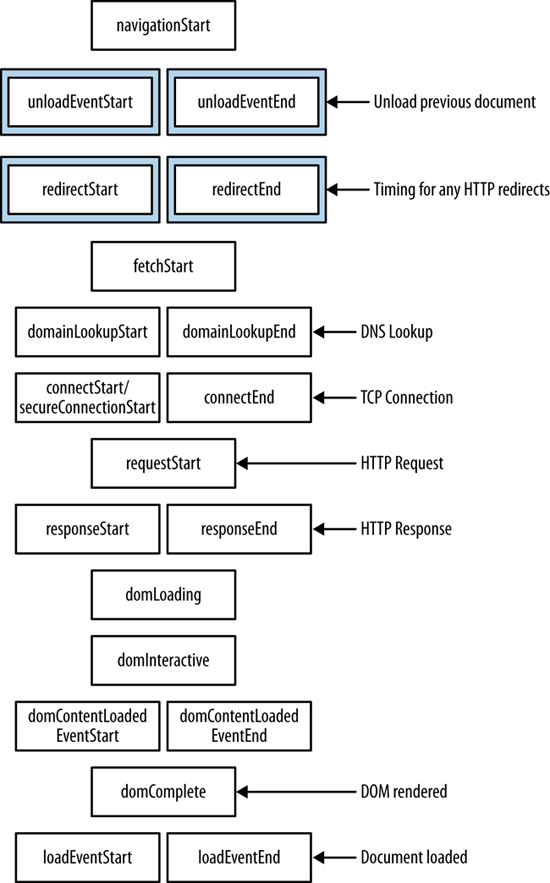
You can craft your own JavaScript libraries to embed in your pages and capture actual RUM from user traffic. Essentially, the JavaScript captures these events and sends them to a server-side endpoint that you can set up to save and analyze these metrics. I have created just such a library at https://github.com/tomjbarker/perfLogger that you are welcome to use.
Web Runtime Performance
As we’ve been discussing, web performance tracks the time it takes to deliver content to your user. Now it’s time to look at web runtime performance, which tracks how your application behaves when the user begins interacting with it.
For traditional compiled applications, runtime performance is about memory management, garbage collection, and threading. This is because compiled applications run on the kernel and use the system’s resources directly.
Running web applications on the client side is different from running compiled applications. This is because they are running in a sandbox, or to put it more specifically, the browser. When they are running, web applications use the resources of the browser. The browser, in turn, has its own footprint of pre-allocated virtual memory from the kernel in which it runs and consumes system resources. So, when we talk about web runtime performance, we are talking about how our applications are running on the client side in the browser, and making the browser perform in its own footprint in virtual memory. Figure 1-12 offers a diagram of a web app running in the browser’s footprint within resident memory.
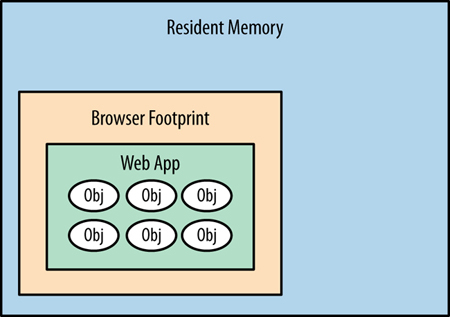
Following are some of the factors we need to consider that impact web runtime performance:
- Memory management and garbage collection
-
One of the first things we need to look at is whether we are clogging up the browser’s memory allocation with objects that we don’t need and retaining those objects while creating even more. Do we have any mechanism to cap the creation of objects in JavaScript over time, or will the application consume more memory the more and longer it is used? Is there a memory leak?
Garbage collecting unneeded objects can cause pauses in rendering or animation that can make your user experience seem jagged. We can minimize garbage collection by reducing the amount of objects that we create and reusing objects when possible.
- Layout
-
Are we updating the DOM to cause the page to be re-rendered around our updates? This is generally due to large-scale style changes that requires the render engine to recalculate sizes and locations of elements on the page.
- Expensive paints
-
Are we taxing the browser by making it repaint areas as the user scrolls the page? Animating or updating any element property other than position, scale, rotation or opacity will cause the render engine to repaint that element and consume cycles. Position, scale, rotation, and opacity are the final properties of an element that the render engine configures, and so will take the least amount of rework to update these.
If we animate width, height, background, or any other property, the render engine will need to walk through layout and repaint the elements again, which will consume more cycles to render or animate. Even worse, if we cause a repaint of a parent element, the render engine will need to repaint all of the child elements, compounding the hit on runtime performance.
- Synchronous calls
-
Are we blocking user action because we’re waiting for a synchronous call to return? This is common when you have checkboxes or some other way to accept input and update state on the server, and wait to get confirmation that the update happened. This will make the page appear sluggish.
- CPU usage
-
How hard is the browser working to render the page and execute our client-side code?
The performance indicators that we will be looking at for web runtime performance are frames per second and CPU usage.
Frames per Second
Frames per second (FPS) is a familiar measurement for animators, game developers, and cinematographers. It is the rate at which a system redraws a screen. Per Paul Bakaus’s excellent blog post “The Illusion of Motion” (http://bit.ly/1ou97Zn), the ideal frame rate for humans to perceive smooth, life-like motion is 60 FPS.
There is also a web app called Frames Per Second (http://frames-per-second.appspot.com) that demonstrates animations in a browser at different frame rates. It’s interesting to watch the demonstration and discern how your own eyes react to the same animations at different frame rates.
FPS is also an important performance indicator for browsers because it reflects how smoothly animations run and the window scrolls. Jagged scrolling especially has become a hallmark for web runtime performance issues.
Monitoring FPS in Google Chrome
Google is currently the leader in creating in-browser tools to track runtime performance. It has included the ability to track FPS as part of Chrome’s built-in Developer Tools. To see this, click the Rendering tab and then check the “Show FPS meter” box (see Figure 1-13).

This renders a small time series chart at the upper right of the browser that shows the current FPS as well as how the number of frames per second have been trending, as depicted in Figure 1-14. Using this, you can explicitly track how your page performs during actual usage.

Although the FPS meter is a great tool to track your frames per second, the most useful tool, so far, to debug why you are experiencing drops in frame rate is the Timeline tool, also available in Chrome Developer Tools (see Figure 1-15).
Using the Timeline tool, you can track and analyze what the browser is doing as it runs. It offers three operating modes: Frames, Events, and Memory. Let’s take a look at Frames mode.
Frames mode
In this mode, the Timeline tool exposes the rendering performance of your web app. Figure 1-15 presents the Frames mode screen layout.
You
can see two different panes in the Timeline tool. The top pane displays the active mode (on the lefthand side) along with a series of vertical bars that represent frames. The bottom pane is the Frames view, which presents waterfall-like horizontal bars to indicate how long a given action took within the frame. You can see a description of the action in the left margin; the actions correspond to what the browser is performing. At the far right side of the Frames view is a pie chart that shows a breakdown of what actions took the most time in the given frame. The actions included are the following:
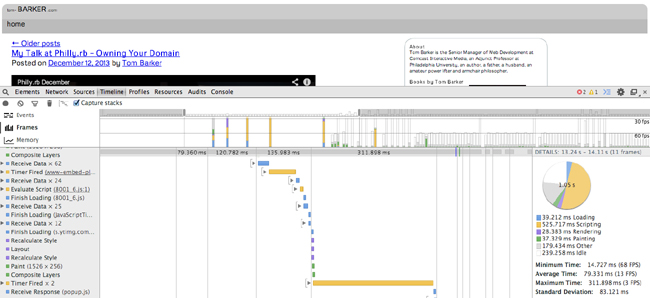
Figure 1-15 shows that running JavaScript took around half of the time, 525 milliseconds out the 1.02 second total.
Using the Timeline tool, in Frame mode, you can easily identify the biggest impacts on your frame rate by looking for the longest bars in the Frame view.
Memory Profiling
Memory profiling is the practice of monitoring the patterns of memory consumption that our applications use. This is useful for detecting memory leaks or the creation of objects that are never destroyed—in JavaScript, this is usually when we programmatically assign event handlers to DOM objects and forget to remove the event handlers. More nuanced than just detecting leakages, profiling is also useful for optimizing the memory usage of our applications over time. We should intelligently create, destroy, or reuse objects and always be mindful of scope to avoid profiling charts that trend upward in an ever-growing series of spikes. Figure 1-16 depicts the JavaScript heap.
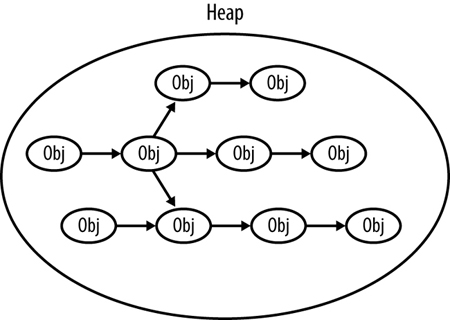
Although the in-browser capabilities are much more robust than they have ever been, this is still an area that needs to be expanded and standardized. So far, Google has done the most to make in-browser memory management tools available to developers.
The MemoryInfo Object
Among the memory management tools available in Chrome, the first that we will look at is the MemoryInfo object, which is available via the Performance object. The screenshot in Figure 1-17 shows a console view.

MemoryInfo objectYou can access the MemoryInfo object like so:
>>performance.memory
MemoryInfo {jsHeapSizeLimit: 793000000, usedJSHeapSize: 37300000, totalJSHeapSize: 56800000}
Table 1-2 presents the heap properties associated with MemoryInfo.
These properties reference the availability and usage of the JavaScript heap. The heap is the collection of JavaScript objects that the interpreter keeps in resident memory. In the heap, each object is an interconnected node, connected via properties such as the prototype chain or composed objects. JavaScript running in the browser references the objects in the heap via object references. When you destroy an object in JavaScript, what you are really doing is destroying the object reference. When the interpreter sees objects in the heap with no object references, the garbage collection process removes the object from the heap.
Using the MemoryInfo object, we can pull RUM around memory consumption for our user base, or we can track these metrics in our lab to identify any potential memory issues before our code goes to production.
The Timeline tool
In addition to offering the Frames mode for debugging a web application’s frame rate, Chrome’s Timeline tool also has Memory mode (shown in Figure 1-18) to visualize the memory used by your application over time and exposes the number of documents, DOM nodes, and event listeners that are held in memory.

The top pane shows the memory profile chart, whereas the very bottom pane shows the count of documents, nodes, and listeners. Note how the blue shaded area represents memory usage, visualizing the amount of heap space used. As more objects are created, the memory usage climbs; as those objects are destroyed and garbage collected, the memory usage falls.
You can find a great article on memory management from the Mozilla Developer Network at http://mzl.la/1r1RzOG.
Firefox has begun to expose memory usage as well, via an “about:memory” page, though the Firefox implementation is more of a static informational page rather than an exposed API. As such, because it can’t be easily plugged into a programmatic process and generate empirical data, the about:memory page is tailored more toward Firefox users (albeit advanced users) rather than being part of a developer’s toolset for runtime performance management.
To access the “about:memory” page in Firefox, in the browser’s location bar, type about:memory. Figure 1-19 shows how the page appears.
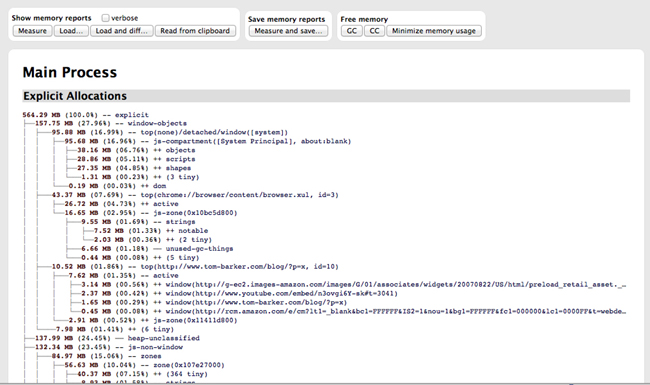
Looking at Figure 1-19, you can see the memory allocations made by the browser at the operating system level as well as heap allocations made for each page that the browser has open.
Summary
This chapter explored web performance and web runtime performance. We looked at how content is served from a web server to a browser and the potential bottlenecks in that delivery as well as the potential bottlenecks in the rendering of that content. We also looked at performance indicators that speak to how our web applications perform during runtime, which is the other key aspect of performance: not just how fast we can deliver content to the end user but also how usable our application is after it has been delivered.
We looked at tools that quantify and track both types of performance.
Most important, we level-set expectations with respect to concepts that we will be talking about at length throughout the rest of this book. As we talk about concepts such as reducing page payload and number of HTTP requests or avoiding repainting parts of a page, you can refer back to this chapter for context.
not available looks at how you can start building responsiveness into your overall business methodology and the software development life cycle.
