Investigating Spark’s performance
A deep dive into performance bottlenecks with Spark PMC member Kay Ousterhout.
 (source: Wikipedia)
For many who use and deploy Apache Spark, knowing how to find critical bottlenecks is extremely important. In a recent O’Reilly webcast, Making Sense of Spark Performance, Spark committer and PMC member Kay Ousterhout gave a brief overview of how Spark works, and dove into how she measured performance bottlenecks using new metrics, including block-time analysis. Ousterhout walked through high-level takeaways from her in-depth analysis of several workloads, and offered a live demo of a new performance analysis tool and explained how you can use it to improve your Spark performance.
Her research uncovered surprising insights into Spark’s performance on two benchmarks (TPC-DS and the Big Data Benchmark), and one production workload. As part of our overall series of webcasts on big data, data science, and engineering, this webcast debunked commonly held ideas surrounding network performance, showing that CPU — not I/O — is often a critical bottleneck, and demonstrated how to identify and fix stragglers.
Network performance is almost irrelevant
While there’s been a lot of research work on performance — mainly surrounding the issues of whether to cache input data in-memory or on machine, scheduling, straggler tasks, and network performance — there haven’t been comprehensive studies into what’s most important to performance overall. This is where Ousterhout’s research comes in — taking on what she refers to as “community dogma,” beginning with the idea that network and disk I/O are major bottlenecks.
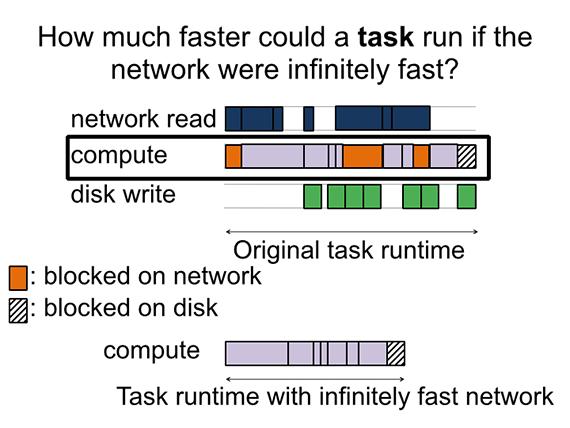
Ousterhout developed a methodology for quantifying performance bottlenecks and used that to measure three SQL workloads, including a TPC-DS workload, of two sizes: a 20 machine cluster with 850GB of data, and a 60 machine cluster with 2.5TB of data. She asked: “How much faster would the job run if the network were infinitely fast?” To find the answer, she measured the amount of time that a job spent blocked on the network. What she found is that the relative importance of the network (or other factors, such as the disk) did not change when she moved to a larger cluster. In fact, she found that the network is almost irrelevant for performance of these workloads — network optimization could only reduce job completion time by, at most, 2%. In the webcast, Ousterhout revealed her next stage of testing — involving the Big Data Benchmark and a production workload from Databricks — and how this testing impacted her findings.
Even though the network may have taken much longer than the time that was blocked on the network, if the task is computing at the same time, speeding up the network in the background isn’t going to have any impact on the task completion time.

10Gbps networking hardware is likely not necessary
Discovery of these results led Ousterhout to question her numbers — after all, they were calling into question a lot of work that’s been done to optimize networks and improve job completion time. With a large Facebook trace in-hand, it was time for a “sanity check”:
The takeaway here is that for the Facebook workload, the median and 75th percentiles are quite a bit lower than all of the workloads that we ran. This shows that the workloads we ran are more network intensive that the workloads run in production.
She went on to corroborate her findings using a test on two additional workloads, with published data from Microsoft and Google.
Disk performance
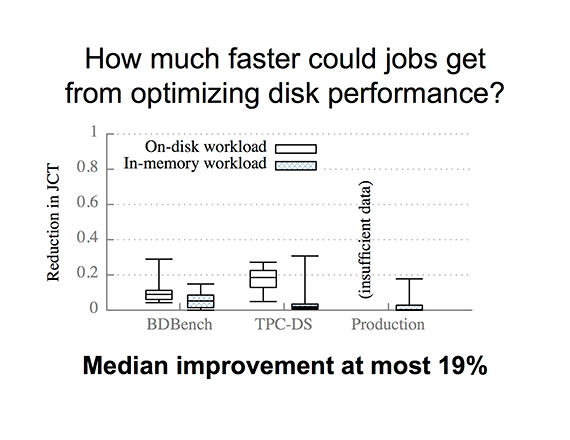
Using the same block-time analysis measuring tool, Ousterhout then asked, “How much faster would jobs complete if the disk were infinitely fast?” Using Amazon EC2 instances, with eight cores and two disks, she found that median performance improvement only reaches 19%, at most.

She explained: “You may not need to store your data in-memory because the job may not get that much faster. This is saying that if you moved the serialized compressed data from on-disk to in-memory, the jobs in the TPC-DS workload could improve in speed at most 19%.”
Ousterhout also clarified that these results do not imply anything about Spark’s performance relative to Hadoop: they focus only on Spark’s performance under different scenarios, and how much Spark could improve as a result of further disk optimizations.
What causes stragglers?
Another area she tackled is the common idea that “stragglers are a major issue and the causes are unknown.” In fact, straggler causes depend significantly on workload (e.g. there are many more garbage-collection-related stragglers in in-memory workloads versus on-disk workloads). Other common causes of stragglers include reading data and writing data to disk.
Watch a live demo
In the free webcast, Ousterhout demonstrated how she uses a publicly available waterfall plot to identify and then fix stragglers, improving Spark’s overall performance. This tool is available to help diagnose performance bottlenecks in your own workloads.
To watch the demo and learn more about Ousterhout’s findings, watch the free archived webcast in its original format here.
Kay Ousterhout is maintainer of the Spark scheduler, where her work focuses on improving scheduler performance. She’s also a Ph.D. student at UC Berkeley, where her research centers around understanding and improving the performance of large-scale analytics frameworks. She’s advised by Sylvia Ratnasamy, and is associated with both the NetSys Lab and AMPLab. To contribute your workloads and have Ousterhout help you diagnose performance problems you may have, contact Ousterhout at keo@cs.berkeley.edu or @kayousterhout on Twitter. Visit her project Web page at eecs.berkeley.edu/~keo/traces.
