 Sculpture (source: Flo's shots 4 me)
 Part I. Introduction
Chaos Engineering is the discipline of experimenting on a distributed system in order to build confidence in the system’s capability to withstand turbulent conditions in production.
If you’ve ever run a distributed system in production, you know that unpredictable events are bound to happen. Distributed systems contain so many interacting components that the number of things that can go wrong is enormous. Hard disks can fail, the network can go down, a sudden surge in customer traffic can overload a functional component—the list goes on. All too often, these events trigger outages, poor performance, and other undesirable behaviors.
We’ll never be able to prevent all possible failure modes, but we can identify many of the weaknesses in our system before they are triggered by these events. When we do, we can fix them, preventing those future outages from ever happening. We can make the system more resilient and build confidence in it.
Chaos Engineering is a method of experimentation on infrastructure that brings systemic weaknesses to light. This empirical process of verification leads to more resilient systems, and builds confidence in the operational behavior of those systems.
Using Chaos Engineering may be as simple as manually running kill -9 on a box inside of your staging environment to simulate failure of a service. Or, it can be as sophisticated as automatically designing and carrying out experiments in a production enviroment against a small but statistically significant fraction of live traffic.
This book explains the main concepts of Chaos Engineering, and how you can apply these concepts in your organization. While the tools that we have written may be specific to Netflix’s environment, we believe the principles are widely applicable to other contexts.
Why Do Chaos Engineering?
Chaos Engineering is an approach for learning about how your system behaves by applying a discipline of empirical exploration. Just as scientists conduct experiments to study physical and social phenomena, Chaos Engineering uses experiments to learn about a particular system.
Applying Chaos Engineering improves the resilience of a system. By designing and executing Chaos Engineering experiments, you will learn about weaknesses in your system that could potentially lead to outages that cause customer harm. You can then address those weaknesses proactively, going beyond the reactive processes that currently dominate most incident response models.
How Does Chaos Engineering Differ from Testing?
Chaos Engineering, fault injection, and failure testing have a large overlap in concerns and often in tooling as well; for example, many Chaos Engineering experiments at Netflix rely on fault injection to introduce the effect being studied. The primary difference between Chaos Engineering and these other approaches is that Chaos Engineering is a practice for generating new information, while fault injection is a specific approach to testing one condition.
When you want to explore the many ways a complex system can misbehave, injecting communication failures like latency and errors is one good approach. But we also want to explore things like a large increase in traffic, race conditions, byzantine failures (poorly behaved nodes generating faulty responses, misrepresenting behavior, producing different data to different observers, etc.), and unplanned or uncommon combinations of messages. If a consumer-facing website suddenly gets a surge in traffic that leads to more revenue, we would be hard pressed to call that a fault or failure—but we are still very interested in exploring the effect that has on the system. Similarly, failure testing breaks a system in some preconceived way, but doesn’t explore the wide open field of weird, unpredictable things that could happen.
An important distinction can be drawn between testing and experimentation. In testing, an assertion is made: given specific conditions, a system will emit a specific output. Tests are typically binary, and determine whether a property is true or false. Strictly speaking, this does not generate new knowledge about the system, it just assigns valence to a known property of it. Experimentation generates new knowledge, and often suggests new avenues of exploration. Throughout this book, we argue that Chaos Engineering is a form of experimentation that generates new knowledge about the system. It is not simply a means of testing known properties, which could more easily be verified with integration tests.
Examples of inputs for chaos experiments:
- Simulating the failure of an entire region or datacenter.
- Partially deleting Kafka topics over a variety of instances to recreate an issue that occurred in production.
- Injecting latency between services for a select percentage of traffic over a predetermined period of time.
- Function-based chaos (runtime injection): randomly causing functions to throw exceptions.
- Code insertion: Adding instructions to the target program and allowing fault injection to occur prior to certain instructions.
- Time travel: forcing system clocks out of sync with each other.
- Executing a routine in driver code emulating I/O errors.
- Maxing out CPU cores on an Elasticsearch cluster.
The opportunities for chaos experiments are boundless and may vary based on the architecture of your distributed system and your organization’s core business value.
It’s Not Just for Netflix
When we speak with professionals at other organizations about Chaos Engineering, one common refrain is, “Gee, that sounds really interesting, but our software and our organization are both completely different from Netflix, and so this stuff just wouldn’t apply to us.”
While we draw on our experiences at Netflix to provide specific examples, the principles outlined in this book are not specific to any one organization, and our guide for designing experiments does not assume the presence of any particular architecture or set of tooling. In Chaos Maturity Model, we discuss and dive into the Chaos Maturity Model for readers who want to assess if, why, when, and how they should adopt Chaos Engineering practices.
Consider that at the most recent Chaos Community Day, an event that brings together Chaos Engineering practitioners from different organizations, there were participants from Google, Amazon, Microsoft, Dropbox, Yahoo!, Uber, cars.com, Gremlin Inc., University of California, Santa Cruz, SendGrid, North Carolina State University, Sendence, Visa, New Relic, Jet.com, Pivotal, ScyllaDB, GitHub, DevJam, HERE, Cake Solutions, Sandia National Labs, Cognitect, Thoughtworks, and O’Reilly Media. Throughout this book, you will find examples and tools of Chaos Engineering practiced at industries from finance, to e-commerce, to aviation, and beyond.
Chaos Engineering is also applied extensively in companies and industries that aren’t considered digital native, like large financial institutions, manufacturing, and healthcare. Do monetary transactions depend on your complex system? Large banks use Chaos Engineering to verify the redundancy of their transactional systems. Are lives on the line? Chaos Engineering is in many ways modeled on the system of clinical trials that constitute the gold standard for medical treatment verification in the United States. From financial, medical, and insurance institutions to rocket, farming equipment, and tool manufacturing, to digital giants and startups alike, Chaos Engineering is finding a foothold as a discipline that improves complex systems.
Prerequisites for Chaos Engineering
To determine whether your organization is ready to start adopting Chaos Engineering, you need to answer one question: Is your system resilient to real-world events such as service failures and network latency spikes?
If you know that the answer is “no,” then you have some work to do before applying the principles in this book. Chaos Engineering is great for exposing unknown weaknesses in your production system, but if you are certain that a Chaos Engineering experiment will lead to a significant problem with the system, there’s no sense in running that experiment. Fix that weakness first. Then come back to Chaos Engineering and it will either uncover other weaknesses that you didn’t know about, or it will give you more confidence that your system is in fact resilient.
Another essential element of Chaos Engineering is a monitoring system that you can use to determine the current state of your system. Without visibility into your system’s behavior, you won’t be able to draw conclusions from your experiments. Since every system is unique, we leave it as an exercise for the reader to determine how best to do root cause analysis when Chaos Engineering surfaces a systemic weakness.
1Julia Cation, “Flight control breakthrough could lead to safer air travel”, Engineering at Illinois, 3/19/2015.
Managing Complexity
Complexity is a challenge and an opportunity for engineers. You need a team of people skilled and dynamic enough to successfully run a distributed system with many parts and interactions. The opportunity to innovate and optimize within the complex system is immense.
Software engineers typically optimize for three properties: performance, availability, and fault tolerance.
- Performance
- In this context refers to minimization of latency or capacity costs.
- Availability
- Refers to the system’s ability to respond and avoid downtime.
- Fault tolerance
- Refers to the system’s ability to recover from any undesirable state.
An experienced team will optimize for all three of these qualities simultaneously.
At Netflix, engineers also consider a fourth property:
- Velocity of feature development
- Describes the speed with which engineers can provide new, innovative features to customers.
Netflix explicitly makes engineering decisions based on what encourages feature velocity throughout the system, not just in service to the swift deployment of a local feature. Finding a balance between all four of these properties informs the decision-making process when architectures are planned and chosen.
With these properties in mind, Netflix chose to adopt a microservice architecture. Let us remember Conway’s Law:
Any organization that designs a system (defined broadly) will inevitably produce a design whose structure is a copy of the organization’s communication structure.
Melvin Conway, 1967
With a microservice architecture, teams operate their services independently of each other. This allows each team to decide when to push new code to the production environment. This architectural decision optimizes for feature velocity, at the expense of coordination. It is often easier to think of an engineering organization as many small engineering teams. We like to say that engineering teams are loosely coupled (very little structure designed to enforce coordination between teams) and highly aligned (everyone sees the bigger picture and knows how their work contributes to the greater goal). Communication between teams is key in order to have a successfully implemented microservices architecture. Chaos Engineering comes into play here by supporting high velocity, experimentation, and confidence in teams and systems through resiliency verification.
Understanding Complex Systems
Imagine a distributed system that serves information about products to consumers. In Figure 2-1 this service is depicted as seven microservices, A through G. An example of a microservice might be A, which stores profile information for consumers. Microservice B perhaps stores account information such as when the consumer last logged in and what information was requested. Microservice C understands products and so on. D in this case is an API layer that handles external requests.
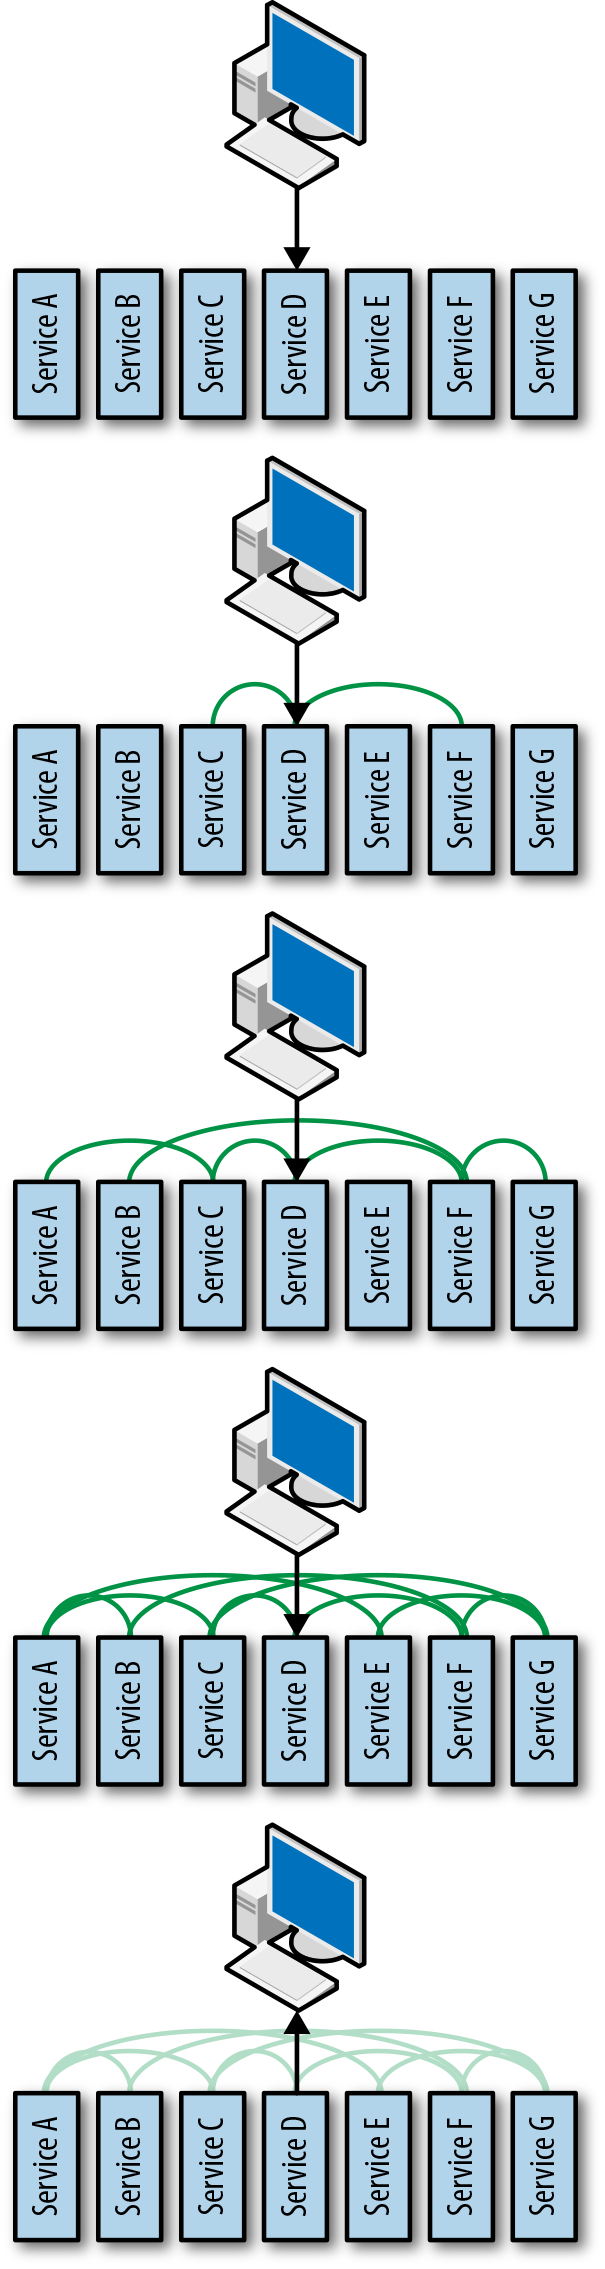
Let’s look at an example request. A consumer requests some information via a mobile app:
- The request comes in to microservice D, the API.
- The API does not have all of the information necessary to respond to the request, so it reaches out to microservices C and F.
- Each of those microservices also need additional information to satisfy the request, so C reaches out to A, and F reaches out to B and G.
- A also reaches out to B, which reaches out to E, who is also queried by G. The one request to D fans out among the microservices architecture, and it isn’t until all of the request dependencies have been satisfied or timed out that the API layer responds to the mobile application.
This request pattern is typical, although the number of interactions between services is usually much higher in systems at scale. The interesting thing to note about these types of architectures versus tightly-coupled, monolithic architectures is that the former have a diminished role for architects. If we take an architect’s role as being the person responsible for understanding how all of the pieces in a system fit together and interact, we quickly see that a distributed system of any meaningful size becomes too complex for a human to satisfy that role. There are simply too many parts, changing and innovating too quickly, interacting in too many unplanned and uncoordinated ways for a human to hold those patterns in their head. With a microservice architecture, we have gained velocity and flexibility at the expense of human understandability. This deficit of understandability creates the opportunity for Chaos Engineering.
The same is true in other complex systems, including monoliths (usually with many, often unknown, downstream dependencies) that become so large that no single architect can understand the implications of a new feature on the entire application. Perhaps the most interesting examples of this are systems where comprehensibility is specifically ignored as a design principle. Consider deep learning, neural networks, genetic evolution algorithms, and other machine-intelligence algorithms. If a human peeks under the hood into any of these algorithms, the series of weights and floating-point values of any nontrivial solution is too complex for an individual to make sense of. Only the totality of the system emits a response that can be parsed by a human. The system as a whole should make sense but subsections of the system don’t have to make sense.
In the progression of the request/response, the spaghetti of the call graph fanning out represents the chaos inherent in the system that Chaos Engineering is designed to tame. Classical testing, comprising unit, functional, and integration tests, is insufficient here. Classical testing can only tell us whether an assertion about a property that we know about is true or false. We need to go beyond the known properties of the system; we need to discover new properties. A hypothetical example based on real-world events will help illustrate the deficiency.
Example of Systemic Complexity
Imagine that microservice E contains information that personalizes a consumer’s experience, such as predicted next actions that arrange how options are displayed on the mobile application. A request that needs to present these options might hit microservice A first to find the consumer’s account, which then hits E for this additional personalized information.
Now let’s make some reasonable assumptions about how these microservices are designed and operated. Since the number of consumers is large, rather than have each node of microservice A respond to requests over the entire consumer base, a consistent hashing function balances requests such that any one particular consumer may be served by one node. Out of the hundred or so nodes comprising microservice A, all requests for consumer “CLR” might be routed to node “A42,” for example. If A42 has a problem, the routing logic is smart enough to redistribute A42’s solution space responsibility around to other nodes in the cluster.
In case downstream dependencies misbehave, microservice A has rational fallbacks in place. If it can’t contact the persistent stateful layer, it serves results from a local cache.
Operationally, each microservice balances monitoring, alerting, and capacity concerns to balance the performance and insight needed without being reckless about resource utilization. Scaling rules watch CPU load and I/O and scale up by adding more nodes if those resources are too scarce, and scale down if they are underutilized.
Now that we have the environment, let’s look at a request pattern. Consumer CLR starts the application and makes a request to view the content-rich landing page via a mobile app. Unfortunately, the mobile phone is currently out of connectivity range. Unaware of this, CLR makes repeated requests, all of which are queued by the mobile phone OS until connectivity is reestablished. The app itself also retries the requests, which are also queued within the app irrespective of the OS queue.
Suddenly connectivity is reestablished. The OS fires off several hundred requests simultaneously. Because CLR is starting the app, microservice E is called many times to retrieve essentially the same information regarding a personalized experience. As the requests fan out, each call to microservice E makes a call to microservice A. Microservice A is hit by these requests as well as others related to opening the landing page. Because of A’s architecture, each request is routed to node A42. A42 is suddenly unable to hand off all of these requests to the persistent stateful layer, so it switches to serving requests from the cache instead.
Serving responses from the cache drastically reduces the processing and I/O overhead necessary to serve each request. In fact, A42’s CPU and I/O drop so low that they bring the mean below the threshold for the cluster-scaling policy. Respectful of resource utilization, the cluster scales down, terminating A42 and redistributing its work to other members of the cluster. The other members of the cluster now have additional work to do, as they handle the work that was previously assigned to A42. A11 now has responsibility for service requests involving CLR.
During the handoff of responsibility between A42 and A11, microservice E timed out its request to A. Rather than failing its own response, it invokes a rational fallback, returning less personalized content than it normally would, since it doesn’t have the information from A.
CLR finally gets a response, notices that it is less personalized than he is used to, and tries reloading the landing page a few more times for good measure. A11 is working harder than usual at this point, so it too switches to returning slightly stale responses from the cache. The mean CPU and I/O drop, once again prompting the cluster to shrink.
Several other users now notice that their application is showing them less personalized content than they are accustomed to. They also try refreshing their content, which sends more requests to microservice A. The additional pressure causes more nodes in A to flip to the cache, which brings the CPU and I/O lower, which causes the cluster to shrink faster. More consumers notice the problem, causing a consumer-induced retry storm. Finally, the entire cluster is serving from the cache, and the retry storm overwhelms the remaining nodes, bringing microservice A offline. Microservice B has no rational fallback for A, which brings D down, essentially stalling the entire service.
Takeaway from the Example
The scenario above is called the “bullwhip effect” in Systems Theory. A small perturbation in input starts a self-reinforcing cycle that causes a dramatic swing in output. In this case, the swing in output ends up taking down the app.
The most important feature in the example above is that all of the individual behaviors of the microservices are completely rational. Only taken in combination under very specific circumstances do we end up with the undesirable systemic behavior. This interaction is too complex for any human to predict. Each of those microservices could have complete test coverage and yet we still wouldn’t see this behavior in any test suite or integration environment.
It is unreasonable to expect that any human architect could understand the interaction of these parts well enough to predict this undesirable systemic effect. Chaos Engineering provides the opportunity to surface these effects and gives us confidence in a complex distributed system. With confidence, we can move forward with architectures chosen for feature velocity as well systems that are too vast or obfuscated to be comprehensible by a single person.
Part II. The Principles of Chaos
The performance of complex systems is typically optimized at the edge of chaos, just before system behavior will become unrecognizably turbulent.
Sidney Dekker, Drift Into Failure
The term “chaos” evokes a sense of randomness and disorder. However, that doesn’t mean Chaos Engineering is something that you do randomly or haphazardly. Nor does it mean that the job of a chaos engineer is to induce chaos. On the contrary: we view Chaos Engineering as a discipline. In particular, we view Chaos Engineering as an experimental discipline.
In the quote above, Dekker was making an observation about the overall behavior of distributed systems. He advocated for embracing a holistic view of how complex systems fail. Rather than looking for the “broken part,” we should try to understand how emergent behavior from component interactions could result in a system drifting into an unsafe, chaotic state.
You can think of Chaos Engineering as an empirical approach to addressing the question: “How close is our system to the edge of chaos?” Another way to think about this is: “How would our system fare if we injected chaos into it?”
In this chapter, we walk through the design of basic chaos experiments. We then delve deeper into advanced principles, which build on real-world applications of Chaos Engineering to systems at scale. Not all of the advanced principles are necessary in a chaos experiment, but we find that the more principles you can apply, the more confidence you’ll have in your system’s resiliency.
Experimentation
In college, electrical engineering majors are required to take a course called “Signals and Systems,” where they learn how to use mathematical models to reason about the behavior of electrical systems. One technique they learn is known as the Laplace transform. Using the Laplace transform, you can describe the entire behavior of an electrical circuit using a mathematical function called the transfer function. The transfer function describes how the system would respond if you subjected it to an impulse, an input signal that contains the sum of all possible input frequencies. Once you derive the transfer function of a circuit, you can predict how it will respond to any possible input signal.
There is no analog to the transfer function for a software system. Like all complex systems, software systems exhibit behavior for which we cannot build predictive models. It would be wonderful if we could use such models to reason about the impact of, say, a sudden increase in network latency, or a change in a dynamic configuration parameter. Unfortunately, no such models appear on the horizon.
Because we lack theoretical predictive models, we must use an empirical approach to understand how our system will behave under conditions. We come to understand how the system will react under different circumstances by running experiments on it. We push and poke on our system and observe what happens.
However, we don’t randomly subject our system to different inputs. We use a systematic approach in order to maximize the information we can obtain from each experiment. Just as scientists use experiments to study natural phenomena, we use experiments to reveal system behavior.
Advanced Principles
As you develop your Chaos Engineering experiments, keep the following principles in mind, as they will help guide your experimental design. In the following chapters, we delve deeper into each principle:
- Hypothesize about steady state.
- Vary real-world events.
- Run experiments in production.
- Automate experiments to run continuously.
- Minimize blast radius.
2Preetha Appan, Indeed.com, “I’m Putting Sloths on the Map”, presented at SRECon17 Americas, San Francisco, California, on March 13, 2017.
Hypothesize about Steady State
For any complex system, there are going to be many moving parts, many signals, and many forms of output. We need to distinguish in a very general way between systemic behaviors that are acceptable and behaviors that are undesirable. We can refer to the normal operation of the system as its steady state.
If you are developing or operating a software service, how do you know if it is working? How do you recognize its steady state? Where would you look to answer that question?
If your service is young, perhaps the only way you know that everything is working is if you try to use it yourself. If your service is accessible through a website, you might check by browsing to the site and trying to perform a task or transaction.
This approach to checking system health quickly reveals itself to be suboptimal: it’s labor-intensive, which means we’re less likely to do it. We can automate these kinds of tests, but that’s not enough. What if the test we’ve automated doesn’t reveal the problem we’re looking for?
A better approach is to collect data that provide information about the health of the system. If you’re reading this book, we suspect you’ve already instrumented your service with some kind of metrics collection system. There are a slew of both open-source and commercial tools that can collect all sorts of data on different aspects of your system: CPU load, memory utilization, network I/O, and all kinds of timing information, such as how long it takes to service web requests, or how much time is spent in various database queries.
System metrics can be useful to help troubleshoot performance problems and, in some cases, functional bugs. Contrast that with business metrics. It’s the business metrics that allow us to answer questions like:
- Are we losing customers?
- Are the customers able to perform critical site functions like checking out or adding to their cart on an e-commerce site?
- Are the customers experiencing so much latency that they will give up and stop using the service?
For some organizations, there are clear real-time metrics that are tied directly to revenue. For example, companies like Amazon and eBay can track sales, and companies like Google and Facebook can track ad impressions.
Because Netflix uses a monthly subscription model, we don’t have these kinds of metrics. We do measure the rate of signups, which is an important metric, but signup rate alone isn’t a great indicator of overall system health.
What we really want is a metric that captures satisfaction of currently active users, since satisfied users are more likely to maintain their subscriptions. If people who are currently interacting with the Netflix service are satisfied, then we have confidence that the system is healthy.
Unfortunately, we don’t have a direct, real-time measure of customer satisfaction. We do track the volume of calls to customer service, which is a good proxy of customer dissatisfaction, but for operational purposes, we want faster and more fine-grained feedback than that. A good real-time proxy for customer satisfaction at Netflix is the rate at which customers hit the play button on their video streaming device. We call this metric video-stream starts per second, or SPS for short.
SPS is straightforward to measure and is strongly correlated with user satisfaction, since ostensibly watching video is the reason why people pay to subscribe to the service. For example, the metric is predictably higher on the East Coast at 6pm than it is at 6am. We can therefore define the steady state of our system in terms of this metric.
Netflix site reliability engineers (SREs) are more interested in a drop in SPS than an increase in CPU utilization in any particular service: it’s the SPS drop that will trigger the alert that pages them. The CPU utilization spike might be important, or it might not. Business metrics like SPS describe the boundary of the system. This is where we care about verification, as opposed to the internals like CPU utilization.
It’s typically more difficult to instrument your system to capture business metrics than it is for system metrics, since many existing data collection frameworks already collect a large number of system metrics out of the box. However, it’s worth putting in the effort to capture the business metrics, since they are the best proxies for the true health of your system.
You also want these metrics to be relatively low latency: a business metric that is only computed at the end of the month tells you nothing about the health of your system today.
For any metric you choose, you’ll need to balance:
- the relationship between the metric and the underlying construct;
- the engineering effort required to collect the data; and
- the latency between the metric and the ongoing behavior of the system.
If you don’t have access to a metric directly tied to the business, you can take advantage of system metrics, such as system throughput, error rate, or 99th percentile latency. The stronger the relationship between the metric you choose and the business outcome you care about, the stronger the signal you have for making actionable decisions. Think of metrics as the vital signs of your system. It’s also important to note that client-side verifications of a service producing alerts can help increase efficiency and complement server-side metrics for a more accurate portrayal of the user experience at a given time.
Characterizing Steady State
As with human vital signs, you need to know what range of values are “healthy.” For example, we know that a thermometer reading of 98.6 degrees Fahrenheit is a healthy value for human body temperature.
Remember our goal: to develop a model that characterizes the steady state of the system based on expected values of the business metrics.
Unfortunately, most business metrics aren’t as stable as human body temperature; instead, they may fluctuate significantly. To take another example from medicine, an electrocardiogram (ECG) measures voltage differences on the surface of a human body near the heart. The purpose of this signal is to observe the behavior of the heart.
Because the signal captured by an ECG varies as the heart beats, a doctor cannot compare the ECG to a single threshold to determine if a patient is healthy. Instead, the doctor must determine whether the signal is varying over time in a pattern that is consistent with a healthy patient.
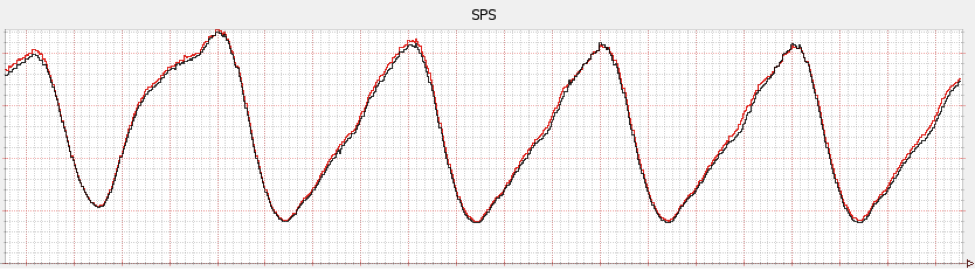
At Netflix, SPS is not a stable metric like human body temperature. Instead, it varies over time. Figure 3-1 shows a plot of SPS versus time. Note how the metric is periodic: it increases and decreases over time, but in a consistent way. This is because people tend to prefer watching television shows and movies around dinner time.
Because SPS varies predictably with time, we can look at the SPS metric from a week ago as a model of steady state behavior. And, indeed, when site reliability engineers (SREs) inside of Netflix look at SPS plots, they invariably plot last week’s data on top of the current data so they can spot discrepancies. The plot shown in Figure 3-1 shows the current week in red and the previous week in black.
Depending on your domain, your metrics might vary less predictably with time. For example, if you run a news website, the traffic may be punctuated by spikes when a news event of great general public interest occurs. In some cases, the spike may be predictable (e.g., election, sporting event), and in others it may be impossible to predict in advance. In these types of cases, characterizing the steady state behavior of the system will be more complex. Either way, characterizing your steady state behavior is a necessary precondition of creating a meaningful hypothesis about it.
Forming Hypotheses
Whenever you run a chaos experiment, you should have a hypothesis in mind about what you believe the outcome of the experiment will be. It can be tempting to subject your system to different events (for example, increasing amounts of traffic) to “see what happens.” However, without having a prior hypothesis in mind, it can be difficult to draw conclusions if you don’t know what to look for in the data.
Once you have your metrics and an understanding of their steady state behavior, you can use them to define the hypotheses for your experiment. Think about how the steady state behavior will change when you inject different types of events into your system. If you add requests to a mid-tier service, will the steady state be disrupted or stay the same? If disrupted, do you expected system output to increase or decrease?
At Netflix, we apply Chaos Engineering to improve system resiliency. Therefore, the hypotheses in our experiments are usually in the form of “the events we are injecting into the system will not cause the system’s behavior to change from steady state.”
For example, we do resiliency experiments where we deliberately cause a noncritical service to fail in order to verify that the system degrades gracefully. We might fail a service that generates the personalized list of movies that are shown to the user, which is determined based on their viewing history. When this service fails, the system should return a default (i.e., nonpersonalized) list of movies.
Whenever we perform experiments when we fail a noncritical service, our hypothesis is that the injected failure will have no impact on SPS. In other words, our hypothesis is that the experimental treatment will not cause the system behavior to deviate from steady state.
We also regularly run exercises where we redirect incoming traffic from one AWS geographical region to two of the other regions where we run our services. The purpose of these exercises is to verify that SPS behavior does not deviate from steady state when we perform a failover. This gives us confidence that our failover mechanism is working correctly, should we need to perform a failover due to a regional outage.
Finally, think about how you will measure the change in steady state behavior. Even when you have your model of steady state behavior, you need to define how you are going to measure deviations from this model. Identifying reasonable thresholds for deviation from normal can be challenging, as you probably know if you’ve ever spent time tuning an alerting system. Think about how much deviation you would consider “normal” so that you have a well-defined test for your hypothesis.
Vary Real-World Events
Every system, from simple to complex, is subject to unpredictable events and conditions if it runs long enough. Examples include increase in load, hardware malfunction, deployment of faulty software, and the introduction of invalid data (sometimes known as poison data). We don’t have a way to exhaustively enumerate all of the events or conditions we might want to consider, but common ones fall under the following categories:
- Hardware failures
- Functional bugs
- State transmission errors (e.g., inconsistency of states between sender and receiver nodes)
- Network latency and partition
- Large fluctuations in input (up or down) and retry storms
- Resource exhaustion
- Unusual or unpredictable combinations of interservice communication
- Byzantine failures (e.g., a node believing it has the most current data when it actually does not)
- Race conditions
- Downstream dependencies malfunction
Perhaps most interesting are the combinations of events listed above that cause adverse systemic behaviors.
It is not possible to prevent threats to availability, but it is possible to mitigate them. In deciding which events to induce, estimate the frequency and impact of the events and weigh them against the costs and complexity. At Netflix, we turn off machines because instance termination happens frequently in the wild and the act of turning off a server is cheap and easy. We simulate regional failures even though to do so is costly and complex, because a regional outage has a huge impact on our customers unless we are resilient to it.
Cultural factors are a form of cost. In the datacenter, a culture of robustness, stability, and tightly controlled change is preferred to agility—experimentation with randomized disconnection of servers threatens that culture and its participants may take the suggestion as an affront. With the move to the cloud and externalization of responsibility for hardware, engineering organizations increasingly take hardware failure for granted. This reputation encourages the attitude that failure is something that should be anticipated, which can drive adoption and buy-in. Hardware malfunction is not a common cause of downtime, but it is a relatable one and a relatively easy way to introduce the benefits of Chaos Engineering into an organization.
As with hardware malfunction, some real-world events are amenable to direct injection of an event: increased load per machine, communication latency, network partitions, certificate invalidation, clock skew, data bloat, etc. Other events have technical or cultural barriers to direct inducement, so instead we need to find another way to see how they would impact the production environment. An example is deploying faulty code. Deployment canaries can prevent many simple and obvious software faults from being deployed, but faulty code still gets through. Intentionally deploying faulty code is too risky because it can cause undue customer harm (see: Minimize Blast Radius). Instead, a bad deploy can be simulated by injecting failure into calls into a service.
We know that we can simulate a bad deploy through failing calls into a service because the direct effects of bad-code deploys are isolated to the servers that run it. In general, fault isolation can be physical or logical. Isolation is a necessary but not sufficient condition for fault tolerance. An acceptable result can be achieved through some form of redundancy or graceful degradation. If a fault in a subcomponent of a complex system can render the entire system unavailable, then the fault is not isolated. The scope of impact and isolation for a fault is called the failure domain.
Product organizations set expectations for availability and own definitions of SLAs—what must not fail and the fallbacks for things that can. It is the responsibility of the engineering team to discover and verify failure domains to ensure that product requirements are met.
Failure domains also provide a convenient multiplying effect for Chaos Engineering. To return to the prior example, if the simulation of a service’s failure is successful, then it not only demonstrates resiliency to faulty code being deployed to that service but also the service being overwhelmed, misconfigured, accidentally disabled, etc. Additionally, you can inject failures into the system and watch the symptoms occur. If you see the same symptoms in real-life, those can be reverse-engineered to find the failure with certain probability. Experimenting at the level of failure domain is also nice because it prepares you to be resilient to unforeseen causes of failure.
However, we can’t turn our back on injecting root-cause events in favor of failure domains. Each resource forms a failure domain with all of the things that have a hard dependency on it (when the resource becomes unavailable, so will all of its dependents). Injecting root-cause events into the system exposes the failure domains that arise from resource sharing. It is common that teams are surprised by the resources that are shared.
We don’t need to enumerate all of the possible events that can change the system, we just need to inject the frequent and impactful ones as well as understand the resulting failure domains. Engineers in your organization may have architected the system with failure domains in mind. In microservices architecture, one of the most important failure domains is the “service” grouping. Teams that believe their services are not critical end up causing outages because their failure was improperly isolated. So, it is important to experimentally verify the alleged boundaries in your system.
Once again, only induce events that you expect to be able to handle! Induce real-world events, not just failures and latency. While the examples provided have focused on the software part of systems, humans play a vital role in resiliency and availability. Experimenting on the human-controlled pieces of incident response (and their tools!) will also increase availability.
Run Experiments in Production
In our field, the idea of doing software verification in a production environment is generally met with derision. “We’ll test it in prod” is a form of gallows humor, which translates to “we aren’t going to bother verifying this code properly before we deploy it.”
A commonly held tenet of classical testing is that it’s better to identify bugs as far away from production as possible. For example, it’s better to identify a bug in a unit test than in an integration test. The reasoning is that the farther away you are from a full deployment in the production environment, the easier it will be to identify the reason for the bug and fix it. If you’ve ever had to debug a failed unit test, a failed integration test, and a bug that manifested only in production, the wisdom in this approach is self-evident.
When it comes to Chaos Engineering, the strategy is reversed: you want to run your experiments as close to the production environment as possible. The ideal implementation runs all experiments directly in the production environment.
When we do traditional software testing, we’re verifying code correctness. We have a good sense about how functions and methods are supposed to behave and we write tests to verify the behaviors of these components.
When we run Chaos Engineering experiments, we are interested in the behavior of the entire overall system. The code is an important part of the system, but there’s a lot more to our system than just code. In particular, state and input and other people’s systems lead to all sorts of system behaviors that are difficult to foresee.
The following sections explore why running in the production environment is vital to Chaos Engineering. We want to build confidence in the system in production, and to do that we need to explore the systemic effects there. Otherwise, we are just building confidence in a system other than the one we care about, which diminishes the value of the exercise.
State and Services
Previously, we spoke about “system state.” In this section, we’ll delve into stateful services. Software engineering would be a lot simpler if our systems did not have to maintain any state. Alas, state is a fact of life in the kinds of systems that we build.
In microservices architecture, when we talk about “state” we are often referring to “stateful services,” such as databases. Systems where the database contains only test fixtures don’t behave the same as systems where the database contains the complete set of production data. Other stateful services include caches, object storage, and durable message queues.
Configuration data is another form of state that affects the way the system behaves. Whether you use static configuration files, a dynamic configuration service like etcd, or (as we do at Netflix) a combination of the two, this configuration information is a form of state that can significantly affect your system behavior.
Even in “stateless” services, there is still state in the form of in-memory data structures that persist across requests and can therefore affect the behavior of subsequent requests.
There’s plenty of state lurking in other places. When running in a cloud environment, the number of virtual machines or containers in an autoscaling group is a form of system state that changes over time as the external demand for different clusters changes. Network hardware such as switches and routers also contain state.
Eventually, some unexpected state is going to bite you. If you’re in the target audience for this book, you probably already have a few scars. In order to catch the threats to resiliency that Chaos Engineering is interested in, you need to expose experiments to the same state problems that exist in the production environment.
Input in Production
One of the most difficult lessons for a software engineer to learn is that the users of a system never seem to interact with it in the way that you expect them to. This lesson is typically learned in the context of designing the user interface of a system, but it’s an important lesson to keep in mind for designing Chaos Engineering experiments.
Assuming your system implements a service, it will receive many different types of requests from your users. You can try to build a synthetic model of user input, but because users never behave the way we expect, the production system will invariably be subject to inputs that don’t show up in your tests with synthetic data.
The only way to truly build confidence in the system at hand is to experiment with the actual input received by the production environment.
Other People’s Systems
A distributed system is one in which the failure of a computer you didn’t even know existed can render your own computer unusable.
Leslie Lamport
Even if we could foresee all of the states of the system under our own control, we invariably depend on external systems, whose behavior we cannot possibly hope to know. Christmas Eve of 2012 is seared into the collective memory of Netflix, when problems with the Amazon Elastic Load Balancing (ELB) service in one geographical region resulted in a significant outage for the Netflix service.
If your system is deployed in a cloud environment such as AWS or Azure, the presence of external systems that you depend on but cannot fully understand is obvious. But even if you are running your system in your own datacenter, there are still external services that you will find yourself dependent on in production, such as DNS, SMTP, and NTP. Even if you deploy these yourselves, often they must communicate with external services over which you have no control.
If you provide a web interface to your service, then your users’ web browsers form part of the system that you have no control over. Even if you have full control over the client, such as an IoT device, you are still ultimately at the mercy of the networking environment that your user is connecting from.
The behavior of other people’s systems will always differ between production and synthetic environments. This reinforces the fact that you want to run experiments in production, the only place where you will have an authentic interaction with those other systems.
Agents Making Changes
At Netflix, our system is constantly undergoing change. Every day, engineers and automated scripts are modifying the system in different ways, such as pushing out new code, changing dynamic properties, and adding new persistent data.
If we extend our concept of the system to include these agents making modifications, it becomes apparent how difficult it is to replicate the system behavior in a test environment.
External Validity
When social scientists like psychologists or education researchers run experiments, one of their primary concerns is “external validity”: do the results of this experiment generalize to the phenomenon that we are really interested in, or is the effect that we measured a product of the environment that was specific to the experiment.
When you don’t run chaos experiments directly in production, the issues that we have discussed in this chapter (state, input, other people’s systems, agents making changes) are all potential threats to the external validity of the chaos experiment.
Poor Excuses for Not Practicing Chaos
We recognize that in some environments it may be difficult or even impossible to run experiments directly in a production environment. We don’t expect engineers to inject noise into the sensors of self-driving cars containing unsuspecting passengers! However, we suspect most users are not working on these kinds of safety-critical systems.
I’m pretty sure it will break!
If you are reluctant to run chaos experiments in production because you do not have high confidence that your system is resilient to the events you are going to inject, then that’s a big warning sign that your system isn’t mature enough to do Chaos Engineering experiments at all. You should go into an experiment with a reasonably high level of confidence that your system is resilient. One of the main purposes of Chaos Engineering is to identify weaknesses in your system. If you already believe the weaknesses are present, then you should be focusing on improving your system resiliency. Once you believe that the system is resilient, go ahead with chaos experiments.
If it does break, we’re in big trouble!
Even if you have high confidence that your system is resilient, you might be hesitant to run a Chaos Engineering experiment out of fear that the experiment will do too much harm if it does reveal a weakness.
This is a legitimate concern, and it is something we wrestle with as well. Our approach is to minimize the potential harm in two ways:
- Make it easy to abort the experiment
- Minimize the blast radius of the experiment
When running any Chaos Engineering experiment, you should have the equivalent of a big red button (ours is a literal, albeit virtual, big red button) that aborts the experiment. Even better is to augment this with an automated system that will automatically abort the experiment when it detects a potentially harmful deviation from steady state.
The second strategy involves designing the experiment to limit the potential harm to be as small as possible while still obtaining meaningful results from the experiment. This is covered in the Minimize Blast Radius section.
Get as Close as You Can
Even if you cannot run directly in production, the closer your experimental environment is to production, the fewer threats to external validity your experiment will have, and the more confidence you can have in the results.
Remember: it’s better to risk a small amount of harm in order to protect the system from suffering a significant outage in the future.
Automate Experiments to Run Continuously
Automation is the longest lever. In the practice of Chaos Engineering, we automate the execution of experiments, the analysis of experimental results, and aspire to automate the creation of new experiments.
Automatically Executing Experiments
Doing things manually and performing one-off experiments are great first steps. As we conjure up new ways to search the failure space we frequently begin with a manual approach, handling everything with kid gloves to gain confidence in both the experiment and the system. All stakeholders are gathered, and a heads-up is broadcast to CORE2 that a new kind of experiment is going to begin.
This apprehension and extreme level of care is appropriate to establish a) the experiment runs correctly and b) the experiment has a minimal blast radius. Once we have successfully conducted the experiment, the next step is to automate the experiment to run continuously.
If experimentation is not automated, it is obsolescent.
The intractable complexity of modern systems means that we cannot know a priori which changes to the production environment will alter the results of a chaos experiment. Since we can’t know which changes can impact our experiments, we have to assume they all do. Through shared state, caching, dynamic configuration management, continuous delivery, autoscaling, and time-aware code, production is in a perpetual state of change. As a result, the confidence in a result decays with time.
Ideally, experiments would run with each change, kind of like a Chaos Canary. When a new risk is discovered, the operator can choose whether or not they should block the roll out of the change and prioritize a fix, being reasonably sure that the rolled out change is the cause. This approach provides insight into the onset and duration of availability risks in production. At the other extreme, annual exercises lead to more difficult investigations that essentially start from scratch and don’t provide easy insight into how long the potential issue has been in production.
If experimentation is not automated, it won’t happen.
At Netflix, each team owns the availability of the services they author and maintain. Our Chaos Engineering team helps service owners increase their availability through education, tools, encouragement, and peer pressure. We can not—and should not—ask engineers to sacrifice development velocity to spend time manually running through chaos experiments on a regular basis. Instead, we invest in creating tools and platforms for chaos experimentation that continually lower the barriers to creating new chaos experiments and running them automatically.
Automatically Creating Experiments
If you can set up experiments that run automatically, on a regular basis, you’re in great shape. However, there’s another level of automation we can aspire to: automating the design of the experiments.
The challenge of designing Chaos Engineering experiments is not identifying what causes production to break, since the data in our incident tracker has that information. What we really want to do is identify the events that shouldn’t cause production to break, and that have never before caused production to break, and continuously design experiments that verify that this is still the case.
Unfortunately, this is a difficult challenge to address. The space of possible perturbations to the system is enormous, and we simply don’t have the time or resources to do a brute-force search across all possible combinations of events that might lead to a problem.
2CORE, which stands for Critical Operations Response Engineering, is the name of the SRE team at Netflix.
Minimize Blast Radius
On April 26, 1986, one of the worst nuclear accidents in human history occurred at the Chernobyl nuclear power plant in the Ukraine. Ironically, the disaster was triggered by a resiliency exercise: an experimental attempt to verify a redundant power source for coolant pumps. While most of us don’t work on projects where the stakes are as high as a nuclear power plant coolant system, each chaos experiment has the potential to cause a production outage. The professional responsibility of the chaos engineer is to understand and mitigate production risks. A well-designed system for experimentation will prevent big production outages by causing only a few customers a small amount of pain.
Unfortunately, we have run experiments that were supposed to only impact a small percentage of users but cascading failures unintentionally impacted more users than intended. In these cases, we had to perform an emergency stop of the experiment. While we never want to cause such a situation, the ability to contain and halt the experiment prevented a much larger crisis. In many ways, our experiments are looking for the unknown and unforeseen repercussions of failure, so the trick is how to shed light on these vulnerabilities without accidentally blowing everything up. We call this “minimizing the blast radius.”
The most confidence-inspiring and risky experiments impact all production traffic. Chaos experiments should take careful, measured risks that build upon each other. This escalation of scope ratchets up confidence in the system without causing unnecessary customer harm.
The lowest-risk experiments involve few users. To accomplish this, we inject failures that verify client-device functionality for a subset or small group of devices. These experiments are limited in the number of devices and user flows that they can affect. They are not a surrogate for production traffic, but they are a good early indicator. For example, if the website tests can’t succeed, it doesn’t make sense to impact real users.
When the automated experiments succeed (or if the functionality under test is not covered by the device tests) the next step is to run small-scale diffuse experiments. An experiment of this style impacts a small percentage of traffic and allows the traffic to follow normal routing rules so it ends up evenly distributed throughout the production servers. For this style of experiment, you need to filter your customer success metrics for the users impacted by the experiment so the impact of your experiment is not lost in the noise. The advantage of a small-scale diffuse experiment is that it should not cross thresholds that would open circuits so you can verify your single-request fallbacks and timeouts. This verifies the system’s resiliency to transient errors.
The next step is to run small-scale concentrated experiments, overriding the routing of requests for all users in this experiment to direct traffic to specific boxes. These boxes will then experience a high concentration of failures and/or latency, allow circuits to open, and should expose hidden resource constraints. If there is a bad fallback or weird lock contention that causes the system to stop servicing requests, then only the users in the experiment will suffer. This simulates a large-scale failure in production while minimizing the negative impact and should provide a high level of confidence.
The most risky and accurate experiment is large-scale without custom routing. At this level, the experiment will show up in your main dashboards and has the potential to impact users not in the experiment group through circuit breakers and shared resource constraints. However, nothing provides more certainty that your system can withstand a given failure scenario than subjecting all of your users to it in production.
In addition to ratcheting up the scope of the experiment, it is imperative to be able to abort in-process experiments when they cause too much pain. Sometimes your system is designed to use a degraded mode that is a minor annoyance for your customers and that is fine, but when the system becomes unavailable or unusable by your customers the experiment should be terminated immediately. This can be handled with the “big red button” as discussed earlier.
Automated termination is highly recommended, particularly if experiments are running continuously in accordance with the other advanced principles. Figuring out how to build a system that can monitor the metric of interest and unwind a chaos experiment in real time is entirely dependent on the unique construction of the system at hand, and is left as an exercise for the reader.
To increase our ability to respond when experiments run amok, we avoid running experiments at risky times. For example, we only run experiments during business hours when everyone is at the the office and ready to work.
The entire purpose of Chaos Engineering is undermined if the tooling and instrumentation of the experiment itself causes undue impact on the metric of interest. We want to build confidence in the resilience of the system, one small and contained failure at a time.
Part III. Chaos In Practice
In Part I and Part II we addressed the motivation for Chaos Engineering and the theory behind the discipline. Putting the theory into practice has its challenges. The software to build, orchestrate, and automate experiments usually doesn’t come for free with any existing system, and even the best framework for chaos needs adoption in order to be useful.
Chaos Engineering originated at Netflix, but its reach now extends throughout tech and into other industries. At conferences we often hear reservations from engineers in other industries like finance who are reluctant to implement chaos because the impact on customers has an immediate and regulated financial impact. We maintain that failures will happen regardless of intention or planning. While running experiments that surface vulnerabilities may cause small negative impacts, it is much better to know about them and control the extent of the impact than to be caught off-guard by the inevitable, large-scale failure. We now see several banks and finance companies adopting Chaos Engineering, providing counterexamples to those in that industry who are hesitant.
Engineers at medical companies have expressed similar hesitations. Sure, a disruption in an entertainment service is inconvenient, and a disruption in a monetary transaction can be confusing and expensive, but any disruption in a healthcare-related technology could put lives on the line. We remind these engineers that many of the principles of western science that inspired our formalization of Chaos Engineering originated in medicine. Clinical trials are the highest standard for medical research. Without trivializing the potential ramifications of introducing chaos into a healthcare-related system, we remind them that there is a well-respected precedent for experimentation where lives literally are at stake.
Putting Chaos Engineering into practice is the most urgent and relevant topic for this nascent discipline. Keeping sight of implementation, sophistication, and adoption concerns can help you figure out where you are on the road to Chaos, and where you need to apply resources to build a successful practice in your organization.
Designing Experiments
Now that we’ve covered the principles, let’s talk about the nitty gritty of designing your Chaos Engineering experiments. Here’s an overview of the process:
- Pick a hypothesis
- Choose the scope of the experiment
- Identify the metrics you’re going to watch
- Notify the organization
- Run the experiment
- Analyze the results
- Increase the scope
- Automate
1. Pick a Hypothesis
The first thing you need to do is decide what hypothesis you’re going to test, which we covered in the section Vary Real-World Events. Perhaps you recently had an outage that was triggered by timeouts when accessing one of your Redis caches, and you want to ensure that your system is vulnerable to timeouts in any of the other caches in your system. Or perhaps you’d like to verify that your active-passive database configuration fails over cleanly when the primary database server encounters a problem.
Don’t forget that your system includes the humans that are involved in maintaining it. Human behavior is critical in mitigating outages. Consider an organization that uses a messaging app such as Slack or HipChat to communicate during an incident. The organization may have a contingency plan for handling the outage when the messaging app is down during an outage, but how well do the on-call engineers know the contingency plan? Running a chaos experiment is a great way to find out.
2. Choose the Scope of the Experiment
Once you’ve chosen what hypothesis you want to test, the next thing you need to decide is the scope of the experiment. Two principles apply here: “run experiments in production” and “minimize blast radius.” The closer your test is to production, the more you’ll learn from the results. That being said, there’s always a risk of doing harm to the system and causing customer pain.
Because we want to minimize the amount of customer pain as much as possible, we should start with the smallest possible test to get a signal and then ratchet up the impact until we achieve the most accurate simulation of the biggest impact we expect our systems to handle.
Therefore, as described in Minimize Blast Radius, we advocate running the first experiment with as narrow a scope as possible. You’ll almost certainly want to start out in your test environment to do a dry run before you move into production. Once you do move to production, you’ll want to start out with experiments that impact the minimal amount of customer traffic. For example, if you’re investigating what happens when your cache times out, you could start by calling into your production system using a test client, and just inducing the timeouts for that client.
3. Identify the Metrics You’re Going to Watch
Once you know the hypothesis and scope, it’s time to select what metrics you are going to use to evaluate the outcome of the experiments, a topic we covered in Hypothesize about Steady State. Try to operationalize your hypothesis using your metrics as much as possible. If your hypothesis is “if we fail the primary database, then everything should be ok,” you’ll want to have a crisp definition of “ok” before you run the experiment. If you have a clear business metric like “orders per second,” or lower-level metrics like response latency and response error rate, be explicit about what range of values are within tolerance before you run the experiment.
If the experiment has a more serious impact than you expected, you should be prepared to abort early. A firm threshold could look like: 5% or more of the requests are failing to return a response to client devices. This will make it easier for you to know whether you need to hit the big red “stop” button when you’re in the moment.
4. Notify the Organization
When you first start off running chaos experiments in the production environment, you’ll want to inform members of your organization about what you’re doing, why you’re doing it, and (only initially) when you’re doing it.
For the initial run, you might need to coordinate with multiple teams who are interested in the outcome and are nervous about the impact of the experiment. As you gain confidence by doing more experiments and your organization gains confidence in the approach, there will be less of a need to explicitly send out notifications about what it is happening.
5. Run the Experiment
Now that you’ve done all of the preparation work, it’s time to perform the chaos experiment! Watch those metrics in case you need to abort. Being able to halt an experiment is especially important if you are running directly in production and potentially causing too much harm to your systems, or worse, your external customers. For example, if you are an e-commerce site, you might be keeping a watchful eye on your customers’ ability to checkout or add to their cart. Ensure that you have proper alerting in place in case these critical metrics dip below a certain threshold.
6. Analyze the Results
After the experiment is done, use the metrics you’ve collected to test if your hypothesis is correct. Was your system resilient to the real-world events you injected? Did anything happen that you didn’t expect?
Many issues exposed by Chaos Engineering experiments will involve interactions among multiple services. Make sure that you feed back the outcome of the experiment to all of the relevant teams so they can mitigate any weaknesses.
7. Increase the Scope
As described in the Minimize Blast Radius section, once you’ve gained some confidence from running smaller-scale experiments, you can ratchet up the scope of the experiment. Increasing the scope of an experiment can reveal systemic effects that aren’t noticeable with smaller-scale experiments. For example, a microservice might handle a small number of downstream requests timing out, but it might fall over if a significant fraction start timing out.
8. Automate
As described in the Automate Experiments to Run Continuously section, once you have confidence in manually running your chaos exercises, you’ll get more value out of your chaos experiments once you automate them so they run regularly.
Chaos Maturity Model
We chose to formalize the definition of Chaos Engineering so that we could know when we are doing it, whether we are doing it well, and how to do it better. The Chaos Maturity Model (CMM) gives us a way to map out the state of a chaos program within an organization. Once you plot out your program on the map, you can set goals for where you want it to be, and compare it to the placement other programs. If you want to improve the program, the axis of the map suggests where to focus your effort.
The two metrics in the CMM are sophistication and adoption. Without sophistication, the experiments are dangerous, unreliable, and potentially invalid. Without adoption, the tooling will have no impact. Prioritize investment between these two metrics as you see fit, knowing that a certain amount of balance is required for the program to be at all effective.
Sophistication
Understanding sophistication of your program informs the validity and safety of chaos experimentation within the organization. Distinct aspects of the program will have varying degrees of sophistication: some will have none at all while others will be advanced. The level of sophistication might also vary between different chaos experimentation efforts. We can describe sophistication as elementary, simple, advanced, and sophisticated:
- Elementary
- Experiments are not run in production.
- The process is administered manually.
- Results reflect system metrics, not business metrics.
- Simple events are applied to the experimental group, like “turn it off.”
- Simple
- Experiments are run with production-like traffic (shadowing, replay, etc.).
- Self-service setup, automatic execution, manual monitoring and termination of experiments.
- Results reflect aggregated business metrics.
- Expanded events like network latency are applied to experimental group.
- Results are manually curated and aggregated.
- Experiments are statically defined.
- Tooling supports historical comparison of experiment and control.
- Sophisticated
- Experiments run in production.
- Setup, automatic result analysis, and manual termination are automated.
- Experimentation framework is integrated with continuous delivery.
- Business metrics are compared between experiment and control groups.
- Events like service-layer impacts and combination failures are applied to experimental group.
- Results are tracked over time.
- Tooling supports interactive comparison of experiment and control.
- Advanced
- Experiments run in each step of development and in every environment.
- Design, execution, and early termination are fully automated.
- Framework is integrated with A/B and other experimental systems to minimize noise.
- Events include things like changing usage patterns and response or state mutation.
- Experiments have dynamic scope and impact to find key inflection points.
- Revenue loss can be projected from experimental results.
- Capacity forecasting can be performed from experimental analysis.
- Experimental results differentiate service criticality.
Adoption
Adoption measures the depth and breadth of chaos experimentation coverage. Better adoption exposes more vulnerabilities and gives you higher confidence in the system. As with sophistication, we can describe properties of adoption grouped by the levels “in the shadows,” investment, adoption, and cultural expectation:
- In the Shadows
- Skunkworks projects are unsanctioned.
- Few systems covered.
- There is low or no organizational awareness.
- Early adopters infrequently perform chaos experimentation.
- Investment
- Experimentation is officially sanctioned.
- Part-time resources are dedicated to the practice.
- Multiple teams are interested and engaged.
- A few critical services infrequently perform chaos experiments.
- Adoption
- A team is dedicated to the practice of Chaos Engineering.
- Incident Response is integrated into the framework to create regression experiments.
- Most critical services practice regular chaos experimentation.
- Occasional experimental verifications are performed of incident responses and “game days.”
- Cultural Expectation
- All critical services have frequent chaos experiments.
- Most noncritical services frequently use chaos.
- Chaos experimentation is part of engineer onboarding process.
- Participation is the default behavior for system components and justification is required for opting out.
Draw the Map
Draw a map with sophistication as the y-axis and adoption as the x-axis. This will break the map into a quadrant, as shown in Figure 9-1.
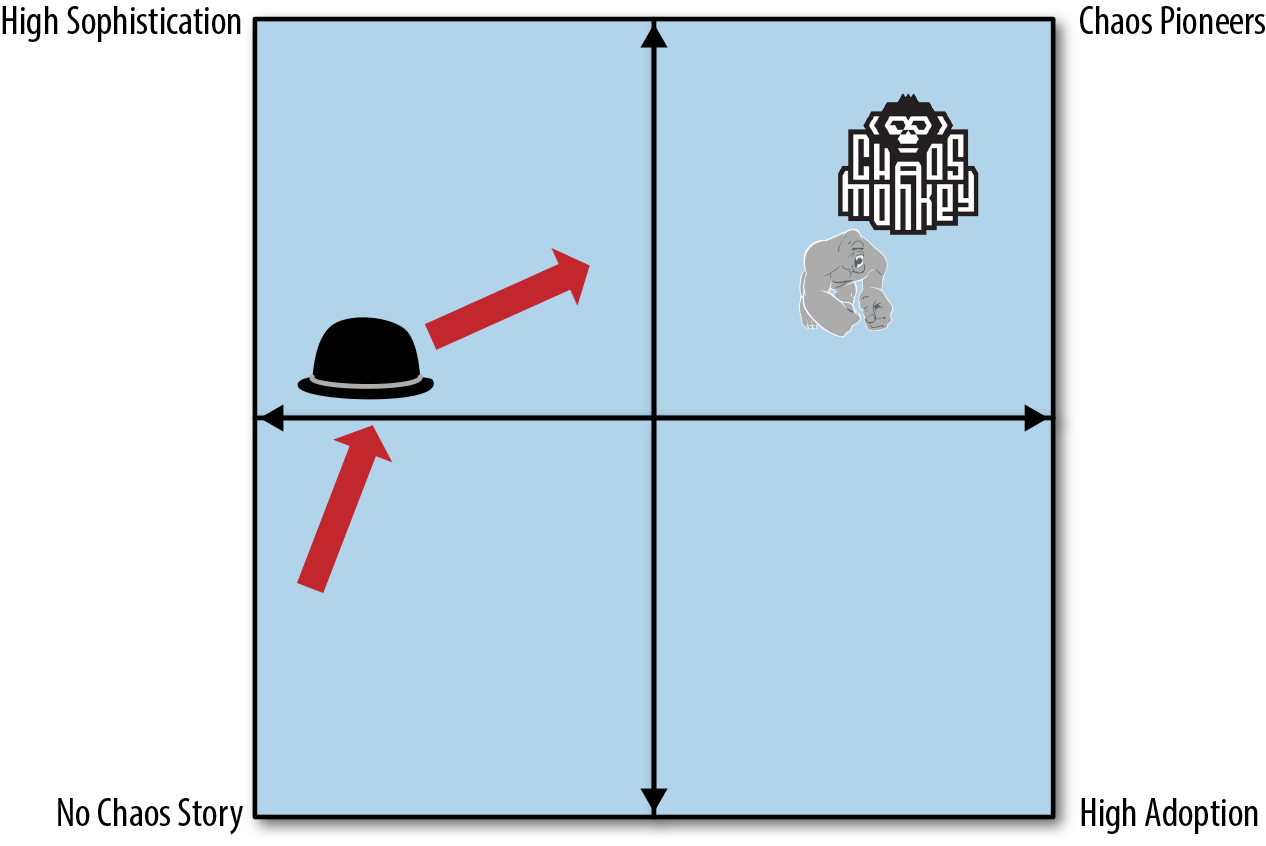
We include Chaos Monkey (the monkey), Chaos Kong (the gorilla), and ChAP (the hat) on map as an example. At the time of writing, we have brought ChAP to a fairly high level of sophistication. Our progress over the previous quarter is represented by the direction of the arrow. We now know that we need to focus on adoption to unlock ChAP’s full potential, and the map captures this.
The CMM helps us understand the current state of our program, and suggests where we need to focus to do better. The power of the model is the map, which gives us context and suggests future direction.
Conclusion
We believe that any organization that builds and operates a distributed system and wishes to achieve a high rate of development velocity will want to add Chaos Engineering to their collection of approaches for improving resiliency.
Chaos Engineering is still a very young field, and the techniques and associated tooling are still evolving. We hope that you, the reader, will join us in building a community of practice and advancing the state of Chaos Engineering.
Resources
We’ve set up a community website and a Google Group that anybody can join. We look forward to you joining the community.
You can find more about Chaos Engineering at Netflix by following the Netflix Tech Blog. Chaos Engineering is happening at other organizations at well, as described in the following articles:
- “Fault Injection in Production: Making the Case for Resiliency Testing”
- “Inside Azure Search: Chaos Engineering”
- “Organized Chaos With F#”
- “Chaos Engineering 101”
- “Meet Kripa Krishnan, Google’s Queen of Chaos”
- “Facebook Turned Off Entire Data Center to Test Resiliency”
- “On Designing And Deploying Internet-Scale Services”
Additionally, there are open-source tools developed by a number of organizations for different use-cases:
- Simoorg
- LinkedIn’s own failure inducer framework. It was designed to be easy to extend and most of the important components are pluggable.
- Pumba
- A chaos testing and network emulation tool for Docker.
- Chaos Lemur
- Self-hostable application to randomly destroy virtual machines in a BOSH-managed environment, as an aid to resilience testing of high-availability systems.
- Chaos Lambda
- Randomly terminate AWS ASG instances during business hours.
- Blockade
- Docker-based utility for testing network failures and partitions in distributed applications.
- Chaos-http-proxy
- Introduces failures into HTTP requests via a proxy server.
- Monkey-ops
- Monkey-Ops is a simple service implemented in Go, which is deployed into an OpenShift V3.X and generates some chaos within it. Monkey-Ops seeks some OpenShift components like Pods or DeploymentConfigs and randomly terminates them.
- Chaos Dingo
- Chaos Dingo currently supports performing operations on Azure VMs and VMSS deployed to an Azure Resource Manager-based resource group.
- Tugbot
- Testing in Production (TiP) framework for Docker.
There are also several books that touch on themes directly relevant to Chaos Engineering:
- Drift Into Failure by Sidney Dekker (2011)
- Dekker’s theory is that accidents occur in organizations because the system slowly drifts into an unsafe state over time, rather than failures in individual components or errors on behalf of operators. You can think of Chaos Engineering as a technique to combat this kind of drift.
- To Engineer Is Human: The Role of Failure in Successful Design by Henry Petroski (1992)
- Petroski describes how civil engineering advances not by understanding past successes, but by understanding the failures of previous designs. Chaos Engineering is a way of revealing system failures while minimizing the blast radius in order to learn on about the system without having to pay the cost of large-scale failures.
- Searching for Safety by Aaron Wildavsky (1988)
- Wildavksy argues that risks must be taken in order to increase overall safety. In particular, he suggests that a trial-and-error approach to taking risks will yield better safety in the long run than to try and avoid all risks. Chaos Engineering is very much about embracing the risks associated with experimenting on a production system in order to achieve better resilience.